Our partnership with Yield Book: Towards climate-informed metrics in sustainable finance


Most recently, the Phase 6 of climate modeling based on the latest Climate Assessment Report (AR6) from the Intergovernmental Panel on Climate Change (IPCC) promises to create a common framework to assess forward-looking climate patterns under different scenarios over the next eighty years. If you are curious as to how all this innovation allows for a better understanding of climate and the dangers your neighbourhood may face, read on.
Components of DECK (Diagnostic, Evaluation and Characterization of Klima) From An overview of CMIP6 Experimental Design and organization
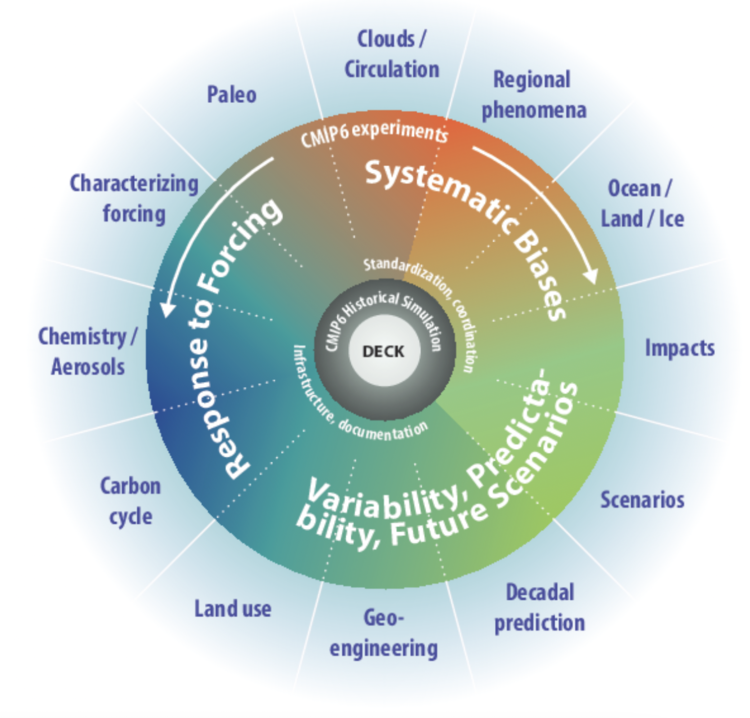
Climate change isn’t isolated to a single suburb, city or region — it is a fundamentally global phenomena that impacts the Earth’s surface. Accurately modeling climate change requires a deep understanding of the different components of the Earth’s systems including the atmosphere, oceans, land, and cryosphere. Each of these systems are represented by a collection fundamental variables:
air temperature
moisture and precipitation levels for the atmosphere
ocean temperature
Ocean water salinity
water circulation for the oceans
carbon absorption
Forests and land use type
soil structure
land use types for the terrestrial system
sea ice and glaciers for the cryosphere
Since these systems are natively interconnected, modeling the changing climate requires making assumptions on how these subsystems will evolve over time under different scenarios of anthropogenic activity. In order to make these complicated, interrelated facets and the mountains of data associated with them more actionable, the IPCC has defined two critical components for consideration.
The IPCC has defined the shared socioeconomic pathways (SSPs), indicative of the social and economic activities and the representative concentration pathways (RCPs) indicative of GHG gas emission concentrations. Being complementary, the SSP-RCP combination allows for a meaningful high-level interpretation of a scenario.
These scenarios have been categorically defined to simplify and broadly capture the underlying assumptions on how we progress as a society with climate issues:
SSP5-RCP8.5 indicates the likely Business as Usual (BAU) scenario. In this scenario, the socioeconomic define hard challenges to mitigation and continued fossil fuel dependence resulting in a likely 8.5 W/sq m of additional energy across the planet by the end of the century relative to pre-industrial conditions.
SSP2-RCP4.5 indicates the likely Middle of the Road (MOR) scenario. In that scenario, the socioeconomics define moderate challenges to adaptation and mitigation and slow progress towards achieving the UN’s Sustainable Development Goals (SDGs). This would likely result in a 4.5 W/sq m additional energy across the planet by the end of the century.
Modeling the Earth system is complex! It is a task that has kept some of the brightest minds of our generation busy and will continue to challenge future generations.
Under different SSP scenarios using the state-of-the-art climate models, we can create projections of the fundamental variables over the coming decades. Since these are complex scenarios, climate scientists will often use a collection of models, called a model ensemble, instead of a single model, when making predictions.
Climate scientists also create models of future physical hazards. Each of the models makes a different set of assumptions when estimating fundamental variables and physical hazard outcomes.
Considering these are complex systems, climate scientists typically use a collection of CMIP6 climate models (called a climate model ensemble) or a collection of simulations from a single model to project future scenarios. The simplest actionable outputs from a model ensemble are the ensemble mean and ensemble variance. Like the ensembles of models for fundamental variables, model ensembles can be created for physical hazards.
Such hazard models can also account for and quantify the associated uncertainties in the climate models: parametric uncertainties capturing doubts the model has on the values of the fundamental variables and structural uncertainties capturing doubts about the relationship between fundamental variables and inputs to the model.
Projections of burned area fractions from a collection of CMIP6 Models from CNRM-ESM2–1 under the SSP5-RCP8.5 Business as Usual climate scenario
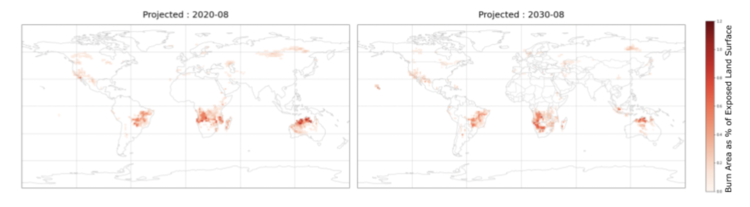
Ensemble means of Model outputs of such hazards can be projected as monthly, annual, or decadal maps.
For simplicity, here I show an example of a map from one of the CMIP6 models, the Centre National de Recherches Météorologiques Earth System Model (CNRM-ESM v2–1), with the map itself being the mean of 5 individual projections from the model. The map shows the projected burned area fraction, i.e. the estimate of percentage of land surface that is covered by burned area, for Aug 2020 and Aug 2030 under SSP5–8.5.
In general, we see that while the regions where wildfires and therefore estimated burned areas remain largely the same, the intensity of fires or the extent of burned area does vary significantly in those regions. We also see the projection of a few new areas like Western Malaysia and the Nordics, where there have been limited fires in the past, showing a higher density of projected burned area.
By simulating outputs from the collection of models over a period of time in the recent past, we can also assess how closely they model the observed spatial temporal patterns of wildfires.
Animation of the monthly estimated burned area fraction from wildfires over North America and Siberia from a collection of CMIP6 models over the past 5 years. Note that the range here is from 0 to 0.4% burned area as a fraction of the exposed land surface. Using an orthographic projection allows us to more closely explore the patterns in these two regions which have seen an increasing incidence of wildfires in recent years
Here we take a closer look at the patterns of burned area over North America and Siberia, we can see the increasing extent of burned area. We can then explore how closely they track the observed fires.
While it can be very helpful to have different indicators of hazard exposure, it can be hard to determine which of these are useful. Enter the world of observations. The MODIS TERRA satellite, operated by NASA, has been a great source of data towards developing a better understanding of changes in terrestrial landscape by providing daily earth observation data at low spatial resolution. Scientists have used this data to assess long term changes in land cover and for the mapping of wildfires in the United States and the rest of the world.
The United States Forest Service’s Remote Sensing Applications Center, the California Fire and Rescue Assistance Program and multiple commercial fire risk product offerings analyze MODIS imagery on a continuous basis to provide information for the management and suppression of wildfires. T
he Level3 processed MODIS monthly active fires archive (MOD14A1) provides an estimate on the number of fires for every 1000 sq km of land surface. Using the statistics of fires in a region and associated measured burned area, we can transform the MODIS active fires map to one of estimated burned area from satellite derived observations.
Notice the growing fires observed through MODIS over the past couple of years in Siberia. Wildfires in Russia have so far burned down an area larger than the size of Greece. Since January of 2020, it is estimated 19 million hectares of forests, steppes and fields have burned across Siberia. About 10 million hectares of these territories suffered forest fires.
Animation of the monthly estimated burned area from wildfires over North America and Siberia from a collection of satellite observations using the NASA MODIS Active Fires L3 product over the past 5 years. Note that the range here is from 0 to 0.4% burned area as a fraction of the exposed land surface. Using an orthographic projection allows us to more closely explore the patterns in these two regions which have seen an increasing incidence of wildfires in recent years
Revealing the Future with Climate Change
A zoomed-in view on the temporal risk profile of burned area fraction estimated over specific regions of the world under the Business as Usual scenario (SSP5-RCP8.5) between 2020 and the close of the century. Starting with two specific regions in North America, Northern California and Alaska, both of which experienced wildfires in the summer of 2019. Top Right: Estimated risk in Anchorage, Alaska and Los Angeles County, California
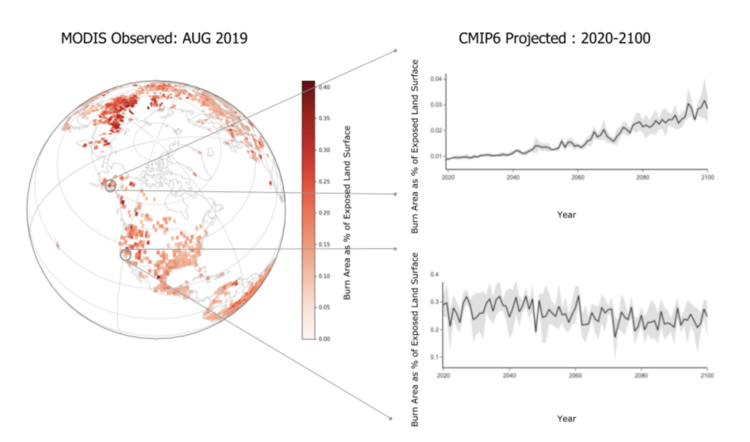
By exploring the estimated burned area from climate models across time, we can visualize the changing patterns of potential wildfire hazards at specific locations across the globe. Here we look at two specific locations that had a significant amount of wildfires in 2019: Southern California and Alaska.
A combination of persistent dryness, warm weather and heavy forestation makes Southern California prone to severe yearly wildfires. 2019 was no different. With caution, we can look at the forward-looking trend of a similar burned area profile projected over the rest of the century.
Conversely, Alaska is not known for its warm or dry environment but has also seen an increase in wildfires in recent years. A closer look at the temporal profile of the estimated burned area presents a more acute story. 2019 brought a record surge in Arctic fires to a region that is warming at more than twice the rate of the rest of the world.
The Arctic contains vast stores of carbon and other planet-warming greenhouse gases in its soils, both in peatlands as well as frozen soil known as permafrost, that can be freed up through combustion. According to one Alaskan wildfire expert, 2019 brought the most extreme fire conditions in the last 40 years. The CMIP6 models project a 400% increase in aggregate burned area towards the close of the century from such changes.
Key Takeaways
Understanding future risk exposure gives us the opportunity to adapt to the changing climate.
The above are some early exploratory steps on how we can use the data from the climate models to explore the expected changing patterns in climate and extreme physical hazard over the coming decades. This is just the tip of the iceberg on the possibilities of forward-looking risk estimation and associated cross validation with observed data. Here are a few specifics worth keeping in mind:
Spatial scale matters. Climate models project risk for the long term at global scale. Yet, decision making often focuses on regional and local spatial scales.
We can begin comparing estimations with observations. Using satellite observations and their derivatives, we can compare observed spatiotemporal patterns with estimated projections from the climate models over the recent past.
Location, Location, Location. Risk Profiling indicates all regions aren’t evolving the same way, location is critical. Different regions will likely exhibit very different evolutions in the risk exposure to wildfires in the coming decades, as seen in the temporal profiles of projected burned areas in Southern California and Alaska.
Sust Global provides actionable climate intelligence, quantifying the accelerating climate impacts facing the world’s biggest financial organizations and critical supply chains. I will cover more on transforming frontier climate science to location-based insights in the coming weeks. If you find this material interesting and care about the changing climate, we would appreciate you forwarding to a friend or leaving a comment.
This Blog was originally posted on the Data Driven Investor Medium page

We use cookies to give you the best online experience. Please let us know if you agree to all of these cookies.