Our partnership with Yield Book: Towards climate-informed metrics in sustainable finance


Many parts of the world are already experiencing weather patterns that have never been seen before, and this trend is expected to continue. As a result, the tools and models that have been used to predict wildfire risk in the past may not be sufficient in the future. Purely empirical approaches based on historical data will fail to predict fire risk under future weather conditions. This is why Sust Global has created a novel modeling approach that is empirical enough to learn useful information from past data using state-of-the-art AI modeling, but at the same time theoretical enough to make reasonable predictions outside the range of training data provided by the historical record. Our novel approach gives our model capabilities that most AI models lack. For example, it can extrapolate and it is readily interpretable.
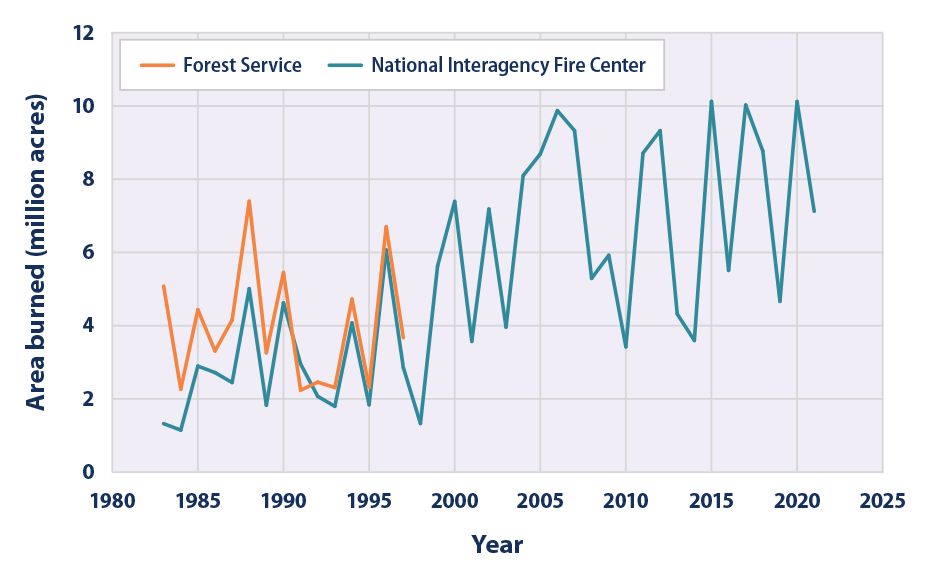
This approach is especially useful in predicting wildfires. Wildfires have become a common occurrence in many parts of the world, and their frequency and intensity have been on the rise in recent years. This increase in wildfire risk can be attributed to a variety of factors, but climate change is undoubtedly one of the most significant. As temperatures continue to rise, droughts become more severe, and extreme weather events become more frequent, the challenge of forecasting wildfire risk becomes even more difficult. For example, in many US States, future fire weather indices are forecast to be higher than anything observed in the past.
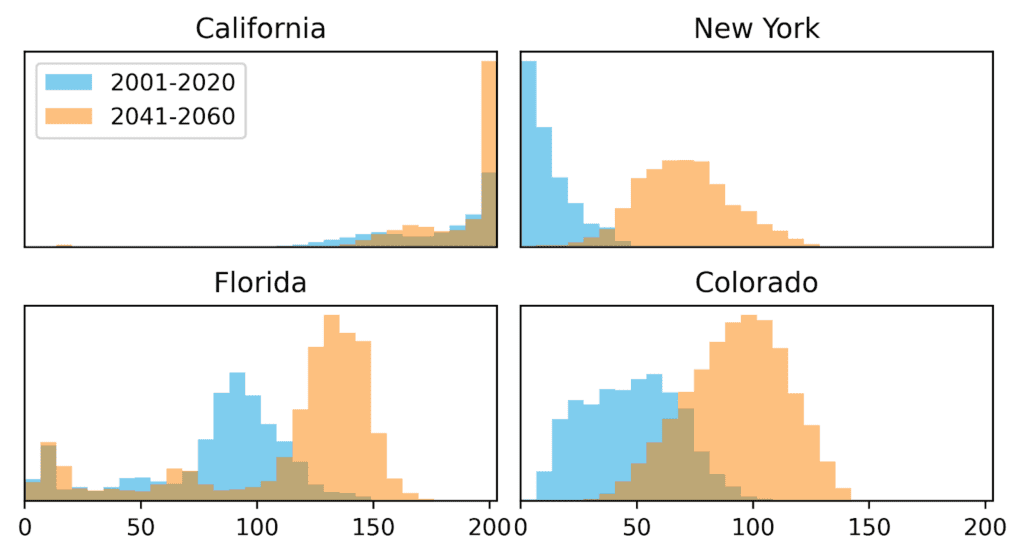
Comparing the distribution of monthly maximum fire weather values (using the KBDI fire weather index) from the recent past to mid-21st century across four states. Many of the future expected KBDI values are outside of the range of historic observations, making modeling the impact of these values challenging.
Our model begins by taking millions of satellite observations of historic fires with high-resolution data on dozens of variables that contribute to fire risk - including daily precipitation and temperature, local topography and land cover, as well as fire suppressability and ignition sources. This is the typical AI approach - take tons of big data, fire up some GPUs, and let the model learn complex relationships that would be hard for a human to decipher.
However, our key innovation is that we force our model into two simple, interpretable layers that disaggregate overall fire risk at a location into baseline fire risk and weather-dependent fire risk. This lets us interpret these layers, and lets our model use weather-dependent fire risk to extrapolate fire risk trends into the future and make reasonable, scientifically-informed predictions in unseen contexts outside of the range of data it has been trained on.
As an example, here is a comparison of how our model learns to separate baseline and weather-dependent fire risk in two locations in the United State: the Flint Hills of Kansas and the Bob Marshall Wilderness of Montana.
From left to right, this graphic shows: (1) the location of the flint hills in Kansas, (2) the historic relationship between the yearly average KBDI fire weather index and the year burned area, (3) a map of the baseline fire risk in the area, with light (dark) values indicating higher (lower) baseline fire risk, and (4) a map of weather-dependent fire risk, with dark (light) values indicating lower (higher) weather-depended fire risk.
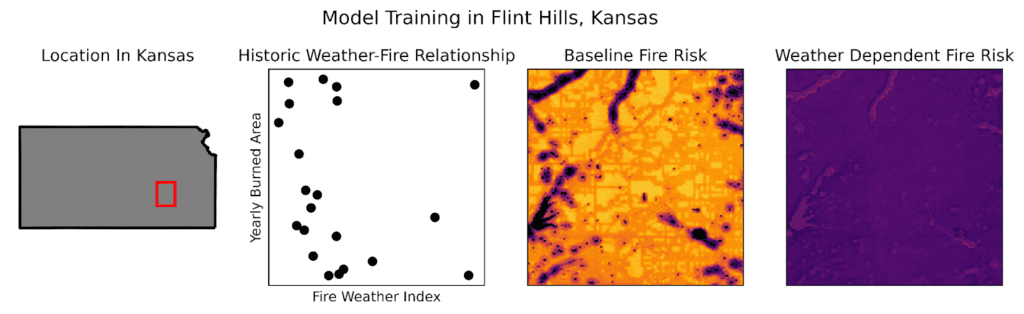
The flint hills are a rocky area in eastern Kansas with the densest coverage of intact tallgrass prairie in North America. Annual prairie fires are common, and are often deliberately set as controlled burns. As shown in the second graphic from left, there is little relationship between annual fire weather and annual burned areas: there have been years with lots of burning and a low fire weather index, and other years with high fire weather but relatively low rates of burning. In such a context where prairie fires are very common but have seemingly little to do with weather conditions, the model has learned that baseline fire risk is very high, but weather-dependent fire risk is low.
From left to right, this graphic shows: (1) the location of the Bob Marshall wilderness in Montana, (2) the historic relationship between the yearly average KBDI fire weather index and the year burned area, (3) a map of the baseline fire risk in the area, with dark (light) values indicating lower (higher) baseline fire risk, and (4) a map of weather-dependent fire risk, with light (dark) values indicating higher (lower) weather-depended fire risk.
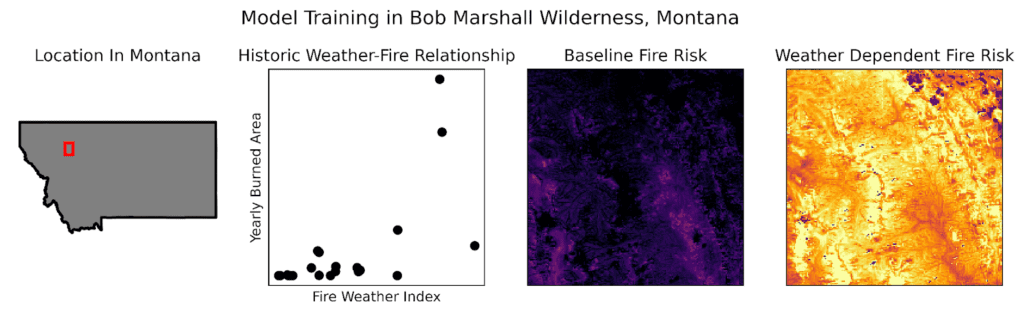
The Bob Marshall Wilderness is a vast wilderness area in the northern Rockies of Montana, and is home to grizzly bears, moose, elk, black bears, mountain goats, and many other species of wildlife. Historically, winters were long and summers were brief while due to the high latitude and high altitude, snow typically persisted through to late spring. However, this is changing with climate change, and recent years have seen unprecedented fire weather and unprecedented fire activity.
This connection between weather and risk is very clear in the second plot, where years with low fire weather have nearly no burned area, while years with high fire weather have very high levels of burning. In such a context, our model will learn that baseline fire risk is low, but weather-dependent fire risk is high. Consequently, our model will extrapolate that even worse fire weather will see even greater levels of burning, in line with what the fire science predicts.
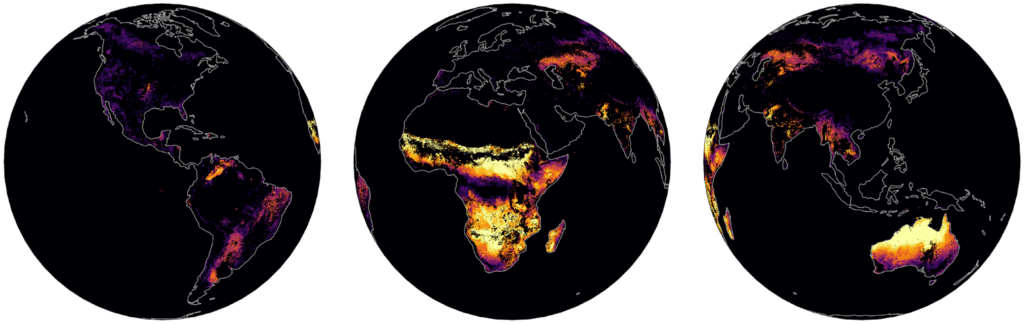
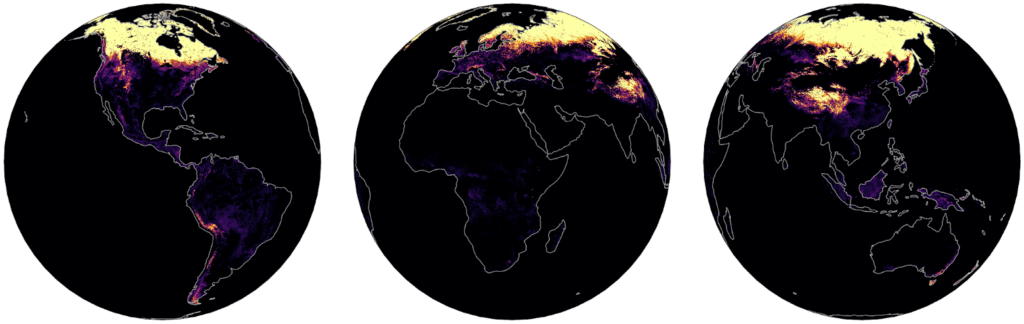
Examining global maps of baseline and weather-dependent wildfire risk shows strong variations between world regions. Tropical savannas show very high levels of baseline wildfire risk, since in those regions it already burns nearly every year. High-altitude and high-latitude forests and meadows, on the other hand, have very high weather-dependent risk. This means that these areas typically don't see fires, but hotter weather is associated with increased wildfire risk. This suggests that these areas will be the most affected by climate change, and that wildfire will be a major issue in a warming world. This is especially true in boreal forests, because that region is seeing much faster warming than other regions.
Global Baseline Wildfire Risk. This graphic shows baseline wildfire risk globally, which is highest in tropical savannas, for example in Africa and Northern Australia. It is lowest in humid forests, from tropical rainforests like the Amazon and Congo, to temperate forests in Europe, Eastern North America, and East Asia.
Global Weather-Dependent Wildfire Risk. This graphic shows weather-dependent wildfire risk globally, which is highest in high-alpine areas as well as in boreal forests. It is lowest in the arid tropics, where fire weather typically already reaches extremely high values annually.
The scientific consensus is that under a business-as-usual scenario of carbon emissions, the entire world will be 5 degrees Celsius hotter in the year 2100. We can't know exactly what fire risk would be in such a hot and dry world, because we have never observed anything like it. We only know that purely empirical models trained solely on historic data will severely underestimate fire risk in such an alien world. This may be why models at some climate risk data providers are predicting a shockingly low 7% increase in fire risk across the US and Western Europe in such a scenario, while other groups suggest only a 50% increase in the number of wildfires globally.
Given that we have already observed a 236% increase in wildfire burned area in the US from the 20th to the 21st century, over a period associated with only 1C increase in temperature, the true fire risk in a world that is 5C hotter is likely much higher than many empirical models are predicting. Using a more theoretical model designed to separate baseline and weather-dependent fire risk in order to extrapolate intelligently into unseen temperature ranges, Sust Global's forecast of a 450% increase in burned area in the US under a 5C hotter world is likely much closer to the true value than other projections. Customers concerned with accurately estimating their fire risk, even decades into the future, should bet on Sust Global's approach.
About the author: Matt Cooper is the Senior Data Science Engineer at Sust Global, where his work runs the gamut from engineering data pipelines to thinking critically about risk models to improving Sust Global’s platform. Before joining our science and product team, Matt was a Data Science Postdoc that Harvard School of Public Health, where he researched the effects of heatwaves and droughts on food security and health. Matt is passionate about making falsifiable predictions about the future, and using new evidence to update his mental and computational models.

We use cookies to give you the best online experience. Please let us know if you agree to all of these cookies.