AI-Driven super resolution of future fire risk exposure
Our FireSRnet model transforms low-resolution fire exposure maps into super-resolution maps, enabling asset-level analytics.
Let’s start with a true story.
In August 2020, people all over the San Francisco Bay Area woke up to what appeared to be the apocalypse.
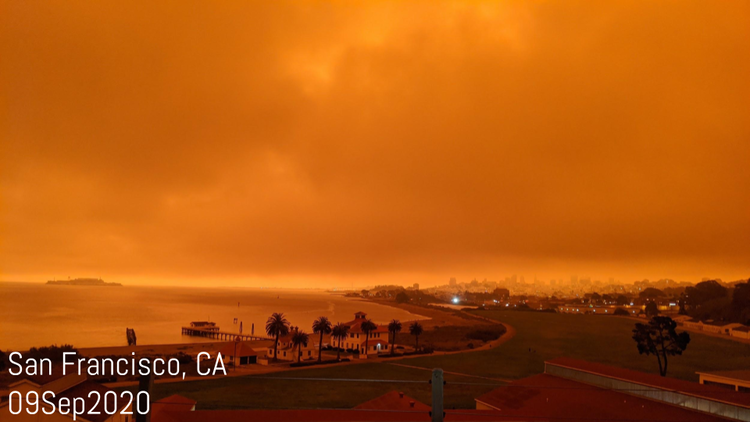
For days, it was dark and ash rained from the sky. But it wasn’t the apocalypse; instead, it was evidence of the wildfires that had raged for months throughout California.
In California, five of the state’s six largest fires have occurred in 2020 alone and, as climate scientists have shown, were intensified by climate change. The fires collectively burned over 4m acres and damaged or destroyed 10,000 structures. The scale of these fires took nearly everyone by surprise, leading to calls for much better estimates of fire exposure.
However, fire maps from some of the world's leading models provide only general estimates of risk. The graphic below shows monthly simulations of burned area from France's National Center of Meteorological Research.
The Problem: Climate models simulate fire risk at low resolution.
Climate models like this are certainly powerful tools that help identify large-scale trends in fire exposure. However, a major limitation is that they have spatial resolutions ranging from 50 to 250km, complicating local or asset-level analytics. What we really need are corresponding high resolution maps of fire exposure.
To address this need for high resolution exposure maps, we looked to recent advances in deep learning and artificial intelligence, particularly the set of methods referred to as image super-resolution. Our fundamental goal of super-resolution is to enhance the spatial resolution of global climate models. The resulting exposure maps enable local risk assessments, which can be used in a host of applications. These include identifying new areas at risk for fire exposure to quantifying the benefits of reducing carbon emissions in line with the Paris Climate Agreement and, therefore, reducing future fire risk.
Of course, the challenge is how to train a super-resolution model to transform low-resolution input imagery to high-resolution outputs. To tackle this problem, we incorporated three high-resolution datasets of past fire exposure, in particular satellite imagery, temperature records, and land cover information.
First, we used monthly high-resolution fire data observed by NASA’s MODIS satellites beginning in March 2000. This timelapse of NASA’s fire data indicates the number of fires observed within a given pixel and is available at 11km resolution, much higher resolution than that of global climate models.
High-resolution satellite imagery enables super-resolution model development.
Second, we developed a burnable land index based on satellite land cover data from the European Space Agency, with values ranging from low burnability in blue to high burnability in yellow. Third, we calculated monthly temperature deviations using temperature data provided by Oregon State’s PRISM group.
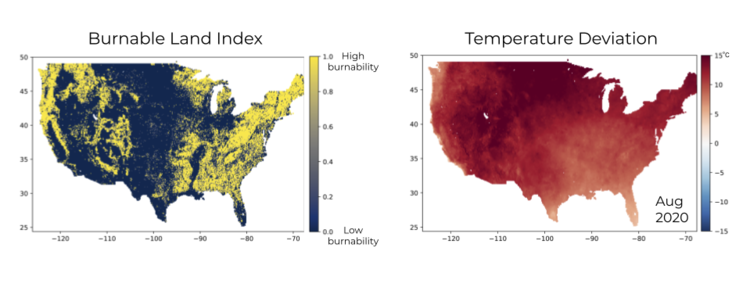
We developed a high-resolution burnable land index and temperature dataset to help train the FireSRnet model.
These three high-quality, high-resolution input datasets, namely the satellite fire exposure, burnable land index, and temperature deviation, enabled us to design a powerful super-resolution model.
When designing our FireSRnet model, we had these goals in mind:
Efficient learning on small datasets: We had one ‘image’ per month for each region we were exploring, meaning 240 images in total covering the 20 years of satellite measurements.
Scale invariance: An architecture that allows for scalability across different resolution scales—going from 2x super-resolution enhancement to 4x and 8x with the same backbone architecture.
Geographic invariance: We wanted to train one model that performed well across multiple geographies. We trained our model over burned area exposure maps in the US and Australia, both areas of high fire exposure in the past five years.
Metadata scalability: Create a model that can take in multiple geoscientific data layers: from temperature to land cover.
We arrived at an architecture that takes multimodal data {fire exposure, burnable land index, and temperature deviation} as a multi-channel ‘image’ as input and uses a sequence of interleaved 2D convolutions and 2D upsampling layers. The 2D convolutional filters have variable filter sizes to account for consistent spatial context across different scales through upsampling. A final 1D convolution creates the super-resolution output burned area exposure image. Our model has only 7.7K trainable parameters, enabling efficient learning.
The architecture also allows for multi-resolution support, enabling 2x, 4x and 8x super-resolution by extending the number of interleaved convolutional and upsampling layers.
When training the FireSRnet model, the first few learning iterations result, encouragingly, in a combination of spot detectors, offset spot detectors, spot eliminators, and sharpening filters. These are indicative of essential functions at the early stages of the network to transform the low-resolution inputs and enable downstream feature maps that are indicative of discriminating features for fire detection.
After training our FireSRnet model on data from 2000 to 2017, we validated its performance using data from 2018 to 2020. In both cases, we benchmark our model performance against traditional bicubic interpolation. For quantitative validation, we found that our model outperformed bicubic interpolation for 4x and 8x enhancement across all metrics.
For qualitative model validation, we examined imagery from northern California in August 2020 (We also examined New South Wales, Australia in the full paper here). The satellite imagery below indicates the massive fires that burned that month.
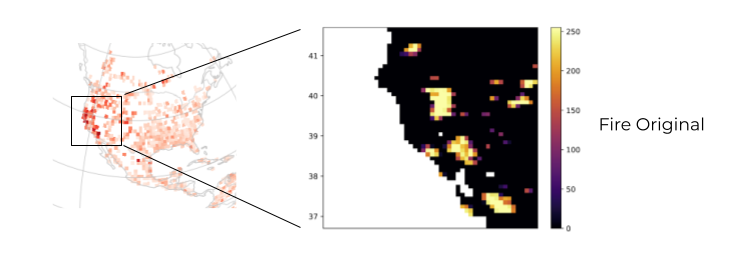
Satellite imagery from NASA captures the unprecedented August 2020 northern California fires.
Focusing here on the 4x super-resolution model, for input we feed in a 4x upscaled version of the original satellite image, along with low-resolution temperature deviations for that month and the burnable land index.
The super-resolution output of our model is of the same 11km resolution as the original satellite fire data, which for August 2020 wasn’t included in model training, enabling visual comparisons.
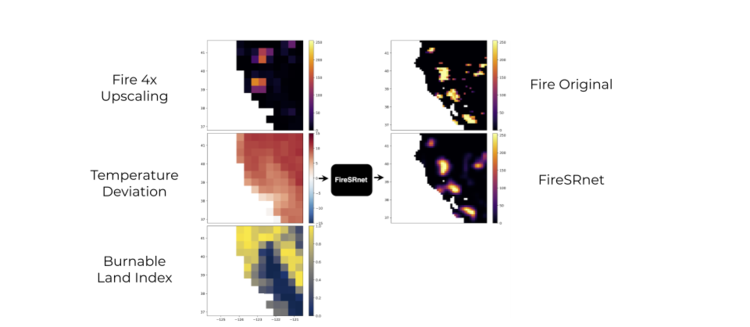
Sust Global’s super-resolution (FireSRnet) is practically identical to the original satellite image of the burned area, which wasn’t included in model training.
Reassuringly, we see strong correspondence between the original satellite data and the super-resolution predictions both in terms of fire detection and fire magnitude.
On the other hand, when we compare the original satellite data with bicubic interpolation, which does not take into account temperature deviations or the burnable land index, we see that while it detects fires reasonably well, it significantly underestimates their magnitude.
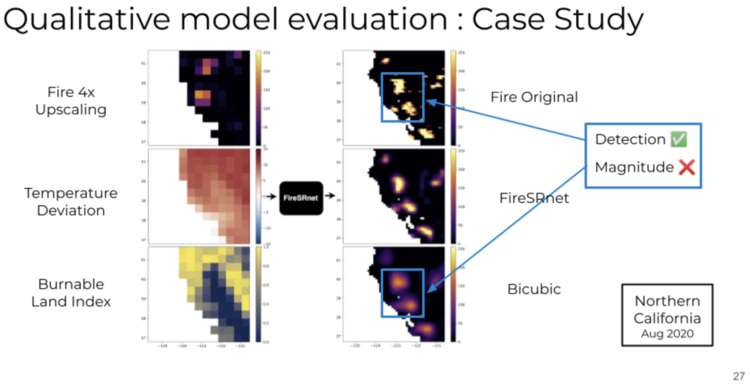
FireSRnet outperforms bicubic interpolation, especially in determining magnitude.
This suggests bicubic interpolation may underestimate the magnitude of severe fires. Overall, the key takeaway from the model validation is that our model has strong performance at 4x super-resolution and clearly outperforms bicubic interpolation.
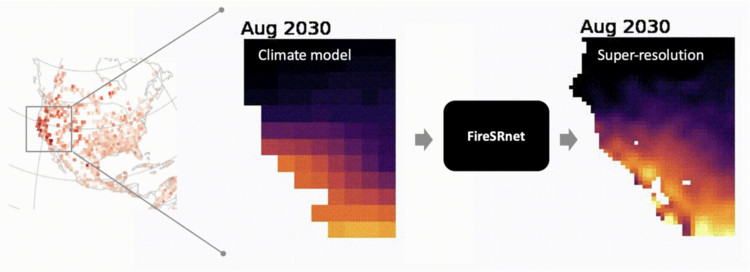
After we trained and validated our models, we applied them to future climate model simulations. Below, on the left are CMIP6 climate model inputs of fire and temperature deviations for forward looking projections under the high emissions scenario (SSP5), along with the burnable land index that we assume is constant across time. The resulting super-resolution fire exposure maps on the right provide much better local detail than the original low resolution input, achieving our primary goal.
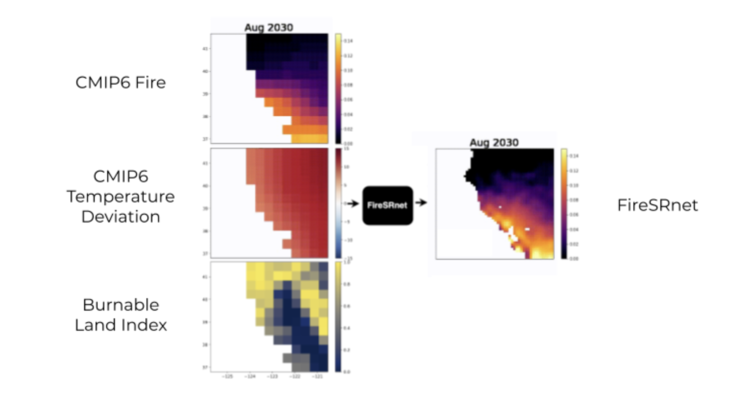
Future climate simulations of fires in northern California
To conclude, we developed what is to our knowledge the first application of super-resolution to fire exposure imagery to outperform standard interpolation techniques at both 4x and 8x enhancement. We also demonstrated the generalizability of this model both over the US and Australia and illustrated applications of super-resolution to the latest state-of-the-art climate models. This is part of our broader mission is to transform complex climate science into actionable insight.
To read the full technical paper, head over to: https://arxiv.org/abs/2011.12353
Want to learn more? Fill out the form below and we'll be in touch shortly!
[hubspot portal="25054470" id="11324217-5628-4ca5-bfaf-af5bff2894c8" type="form"]