Climate modeling part 3: machine learning (ML) for asset-level assessments [video]
In this video, Gopal discusses how we use machine learning to enable transparent, easy-to-understand asset-level assessments of physical climate risk to your investments and properties. This allows you to better plan and mitigate risk as well as create new, validated sustainable financial products.
Video transcript:
[Gopal] Here's a projection from one of the climate models.
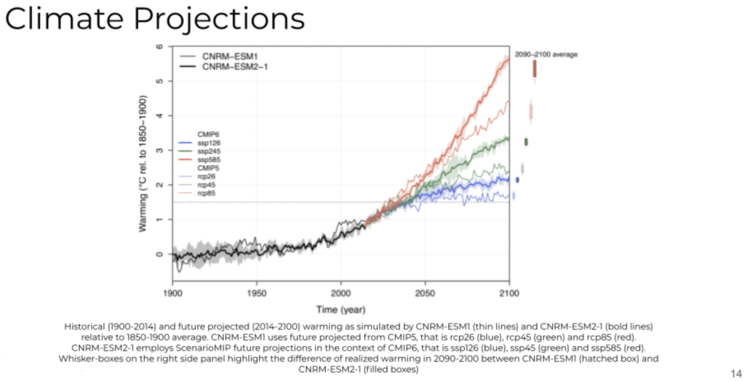
There’s some version of this that you've all seen when you’ve read about climate modeling. This one is from the CNRM model, from the European Research Lab.
What you see in black is the historic observations all the way out to 2014 or 2015. What you see in the red, green, and blue are three different scenarios, which are mapped out. Red is the business as usual scenario. If we keep on the same level of energy and land use and socioeconomic development, as we've seen since the 1900's, we expect this scenario, which is a high degree of warming with little or no climate adaptation and mitigation.
What you see in green is the middle of the road scenario, also called SSP245. That is what we expect if we incorporate some climate adaptation and mitigation. Lastly, the most positive, in the context of climate change, and the least disruptive to the ecosystem, is the blue scenario, which is called the SSP126, or the green road in some contexts.
This indicates a much smaller variability terms of rising temperatures and warming, which would be a result of heavy amounts of climate adaptation and mitigation in the decades to come. Many of the activities you see at the global scale – such as the Paris agreement, the COP26, and different forms of regulatory and disclosure reporting frameworks -- are all intended to get us closer to this green road scenario. It'll be interesting to see how we close we get.
Any of the complex physical hazards like wildfires, flooding, are built on top of foundational models like this which cover the fundamental variables like temperature and precipitation. Here's an example of one of the acute hazards that has been hitting most of the Pacific Northwest United States in 2020 and 2021.
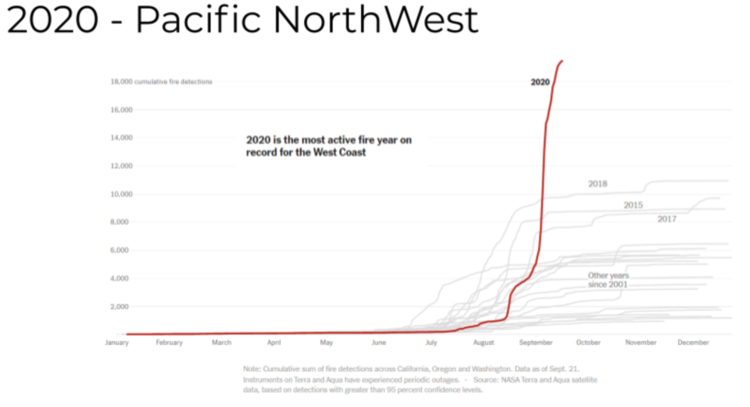
2020 recorded the highest amount of active fires in recorded history over the west coast of the United States. (Although now it looks like it will be outpaced by 2021) And you can see it's higher by a significant amount. That's indicative of the warming of the earth and the dryness in the land ecosystem.
The above graph is over California, Oregon, and Washington, as of September 2020. It’s derived from measurements from the Terra and Aqua satellites that are designed by the NASA modus team. In September, 2020, we saw the highest incidence of wildfires in California at that time, and it led to increasing aerosol content in the Earth's atmosphere, which led to the whole sky looking orange all through the daylight hours.
If we were to look more closely at the projections of climate related model simulations over this region, this is an animation of that view.
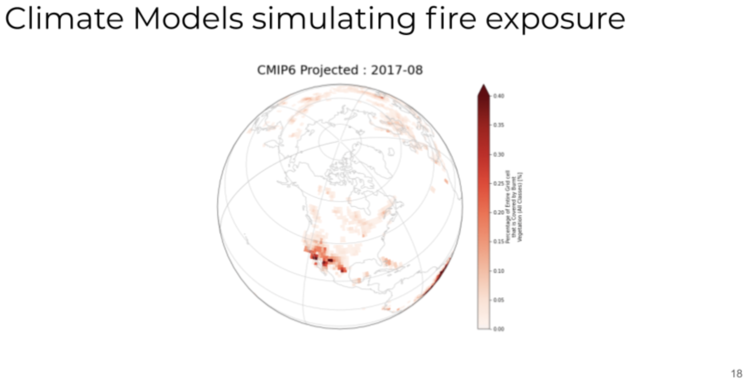
Month over month, what you're seeing over the last few years is an increasing amount of hazard, culminating in 2020, which has a fair bit of projected exposed, burnt area. Now the point of comparison is to look at ground truth satellite derived measurements.
There's a clear need for being able to make the climate modeling data actionable which means going from the one degree grid cell sized global climate model projections to asset level projections at the five to ten kilometer grid cell size. That begs the need for a super resolution and additional techniques for increasing the resolution of the climate projections.
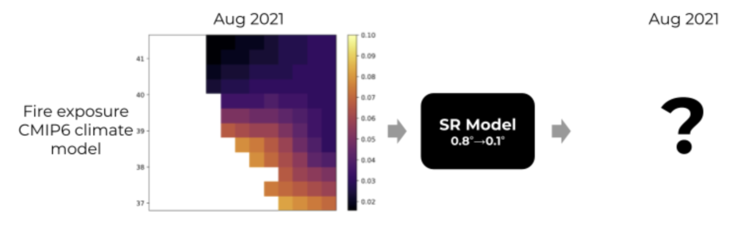
Here’s example of what the grid cells looked like for climate projections across the San Francisco Bay. In the lighter hues are the higher incidents of light projected exposed, burnt areas. The goal is to go from the .8 degrees to .1 degrees.
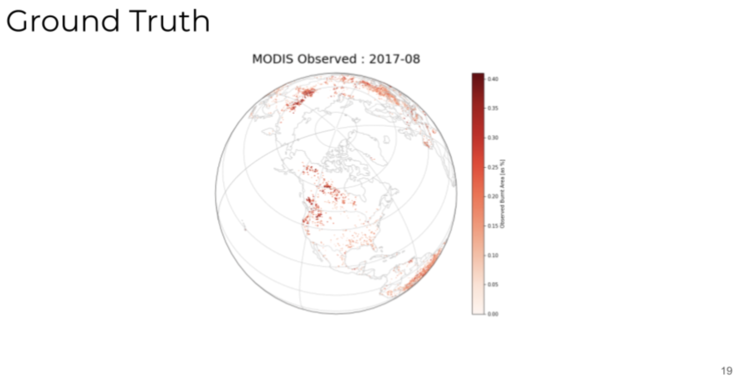
We have seen a lot of improvements in super resolution in photo realistic imagery, but applying it to these kinds of techniques is still hard because it's fundamentally a different type of data. It's earth observation and climate model projections. So if you were to design a super resolution model on the August, 2021 data, you would ideally want to get to a much finer grid cell. One tool that comes handy is the ground truth observed wildfires across North America over the course of the last five years.
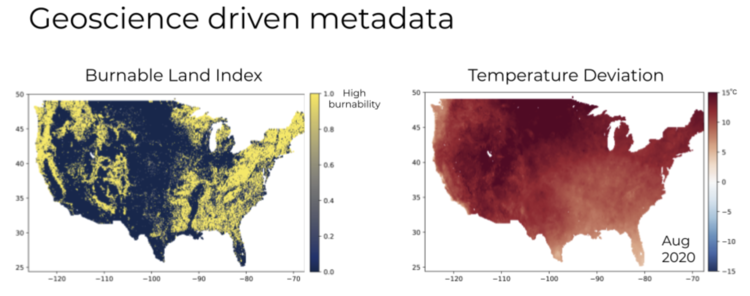
A geoscience derived metadata list that you can look at is burned area or burnable land index. For example, in areas where there’s sand, it's less likely to burn and areas where there's vegetation and tree cover, there's a higher likelihood of burning. From those lists we can construct a burnable land index, which is also satellite derived.
Another geoscience list is temperature deviation. How much radiation are you seeing in annual observed temperatures projected historically and what you're seeing presently? That temperature deviation is another signal that can be fed in month over month, along with the fire risk and fire exposure data.
The goal is to use these additional metadata layers, along with historic observations, to learn a model that goes from .8 degrees to .1 degrees in terms of super resolution, and then apply it to the climate projections for the future years so that you have asset level granularity in the projections of climate model outputs. In other words the design goals for the super resolution model derived from geospatial and geoscience data, is fairly straightforward:
Efficient learning on small datasets
Resolution scalability
Spatiotemporal generalization
Extensible geoscience inputs
There's a new data set. So the model needs to learn efficiently on smaller data sets because we have only monthly projections at fairly close granularity and we want to be able to scale across resolutions. So, if we want to increase by 2X, 4X, or 8X, super resolution should be possible.
We would also want to be able to generalize spatial-temporally. And what I mean by that is we should be able to learn a model that can be applied across different continents and across different temporal scales. So what you learn over the 2010 to 2020 time horizon should be effective in terms of projecting out super resolution on wildfire exposure in the coming decade, 2021 to 2030. We will also be able to add more geoscience inputs in the future like dryness and related signals.
This is kind of the efficient network architecture we came up with, which is going from a low resolution input, derived from the geospatial observations, into 4X higher resolution.
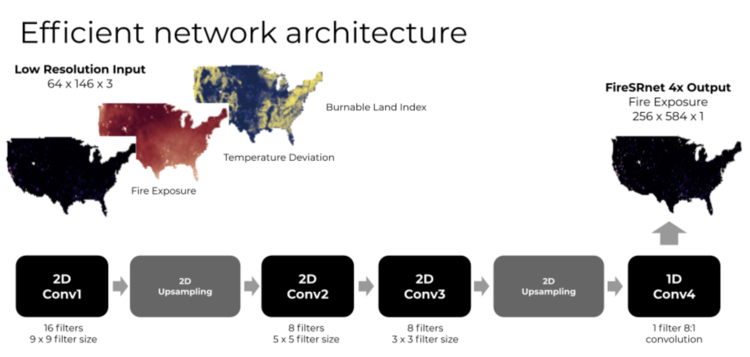
It’s a sequence of convolutional and up-sampling layers coupled with the final 1D convolutional layer that gets it to the super resolution output.
And here’s some ways to extend that:
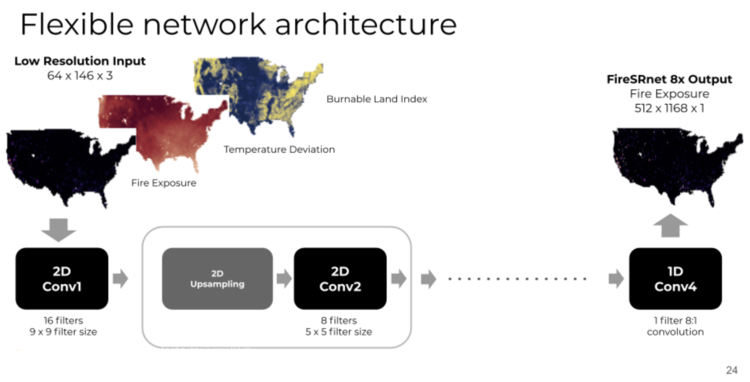
So if you were to go from 2X to 4X, you would add an additional 2D up-sampling and 2D convolution layer. And if you wanted to go to 8X, you would add another additional 2D up-sampling and 2D convolution layer. In that way, this network architecture is flexible and scalable.
Here’s the discriminator features that we learned for wildfire detection.
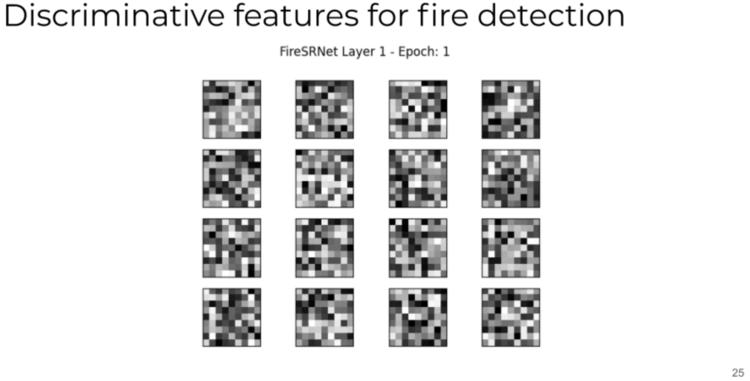
As we go from the first epoch to the 50th epoch, we begin to see more edge detection, gradient detection, and notch filtering, central for effective super resolution. This is an indication of the fact that the network is learning the right thing as we train the model. When you go from the 4X up-sampling, low resolution input derived from the modus data to get a high resolution version of the same.
So every grid cell on the left is replaced by 16 grid cells, four by four in the original dataset. Then, using these additional layers, we can then project out what it might look like for August, 2020. We can see that the model here, which we call SuRe Fire™ detects as well as tracks the magnitude of the fire exposure. That's ideally what we want.
We want to be able to identify where the wildfire is, and the magnitude and the exposure. This is the kind of thing we just don't get when we do a very simple kind of interpolation, which is not super resolution driven and is more washed out the bicubic interpolation.
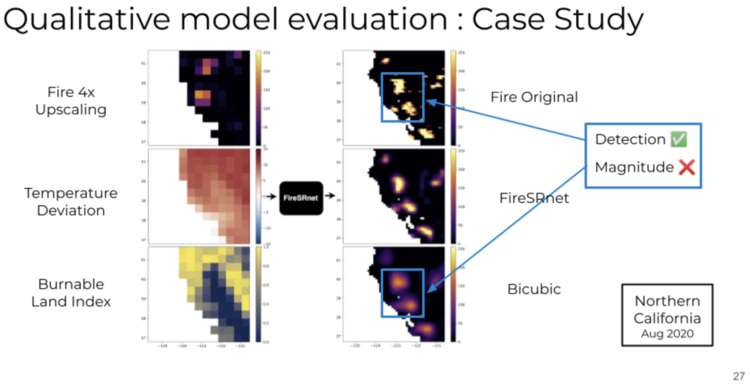
This started out with this 4X up-sampled or upscaled dataset. Then we essentially have blobs, which are just low pass filtered versions of the original, just at higher resolution. So it tracks detections, but often is very poor at magnitude detection because of the nature of the processing. We can then apply that learned model, for 4X or 8X super resolution on forward-looking projections when we don't have ground truth, and then benchmark that against ground truth as the months evolve.
Here's an example of such a simulation applied to the CMIP6 data set:
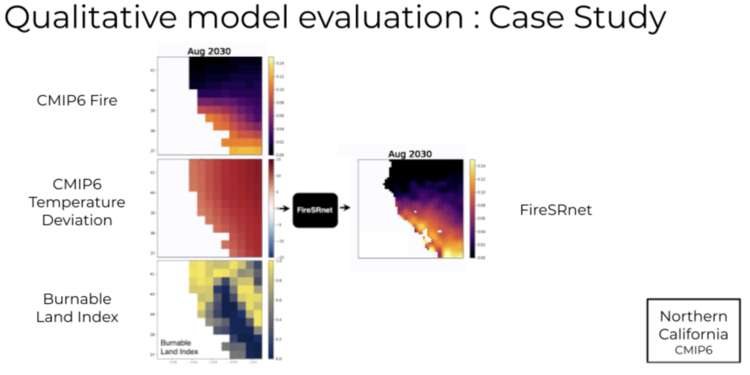
More on this and the technique as well as the qualitative and quantitative assessment can be found in the FireSRnet paper that we be presented at NeurIPS in December, 2020. It's part of the climate change workshop track and goes into a fair bit of detail around the techniques that we've used.
Want to learn more about Sust Global? Fill in the form below and we'll be in touch shortly!
[hubspot portal="25054470" id="11324217-5628-4ca5-bfaf-af5bff2894c8" type="form"]