Not all assets are created equal in the eyes of climate risk
More than ever, business leaders view climate change not only a threat but also an opportunity for transition and growth.
For the first time in PWC’s annual CEO report, climate change made the top ten concerns.
The second largest emitter of greenhouse emissions, the United States has done a 360 on climate with the new administration and is back in the Paris Accord.
In his annual letter to CEOs, Black Rock CEO, Larry Fink, declares climate transition a historic investment opportunity.
The US Federal Reserve has not only introduced climate as a priority in its reporting but has also created two panels dedicated to understanding climate risk to the financial system.
The EU has been adopting TCFD as a disclosure framework across asset managers, investors and bankers.
Globally financial markets are growing their ESG and sustainability groups as they try to quickly understand how to integrate climate into their risk management programs and look for new opportunities in green bonds and other financial products.
But despite these shifts, organizations are still unclear on the immediate next steps. This is caused by a lack of regulatory clarity and transparent, validated climate data.
Regulatory changes… kind of!
There’s no mandated regulation on what constitutes accurate climate reporting. Most organizations rely on self-reporting to determine climate risk, leading to increasing skepticism and claims of “green-washing.” The multitude of reporting and disclosure frameworks only adds to the confusion (TCFD, SASB, GRESB, NGFS, PRI, PRB, the list goes on...)
From data to insight
There is also a skills gap in translating the available data from earth observation, ground-based sensors and climate projections. Today, this complex data is nearly impossible to interpret by anyone who isn’t a climate scientist.
The data is available, companies just need it in a format that they can use. As we discussed in our blog, It matters when it’s in your backyard, climate intelligence is what makes climate science and the massive amounts of geospatial data, intelligible. Through AI and the coupling of different kinds of data sets (ie for burnable land index with Global Climate Models) we can transform this information into localized, asset specific risk exposure metrics . By doing this one of the most glaring lessons we’ve learned is that not all assets are created equal.
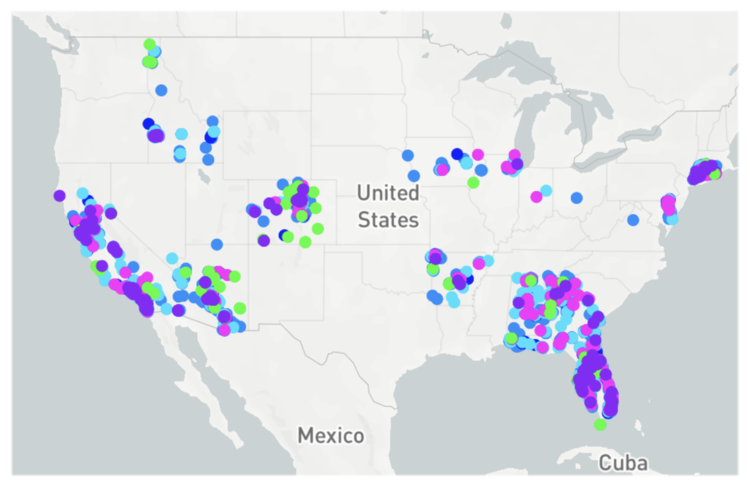
Assets are color-coded according to type: retail, residential, industrial, land etc.
A case study: Oakland vs. Loveland
Let’s start by taking a look at the assets of a US Mortgage Portfolio.
There are a fair amount of properties all over the states so we’ll select two retail properties, both worth close to $3.7million - one in North Oakland, California, the other in Loveland, Colorado. We might believe that potential risk for each space to be similar. Yet when we select wildfire risk and look at it in the heatmap view we see a different story.
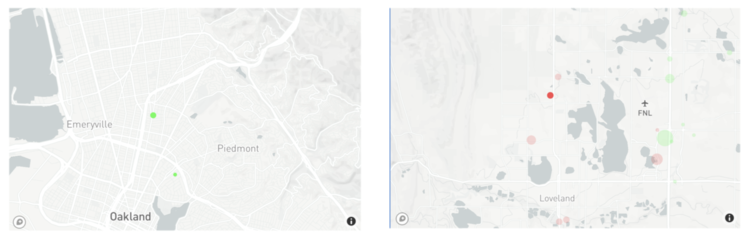
Zoomed in heatmap view shows green or low risk for the Oakland retail space and red or high fire risk for the Loveland retail property.
Now let’s change to satellite view and zoom in closer.
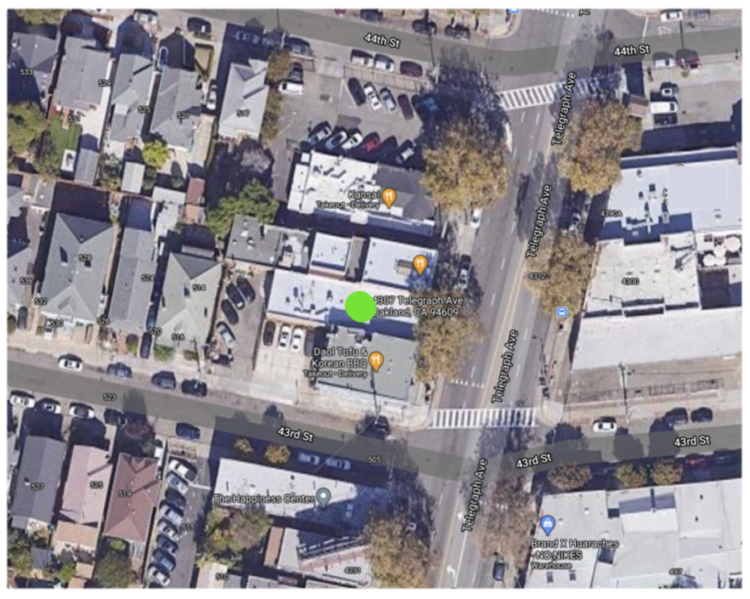
Satellite view of retail space in Oakland, CA. Green signifies low risk of fire.
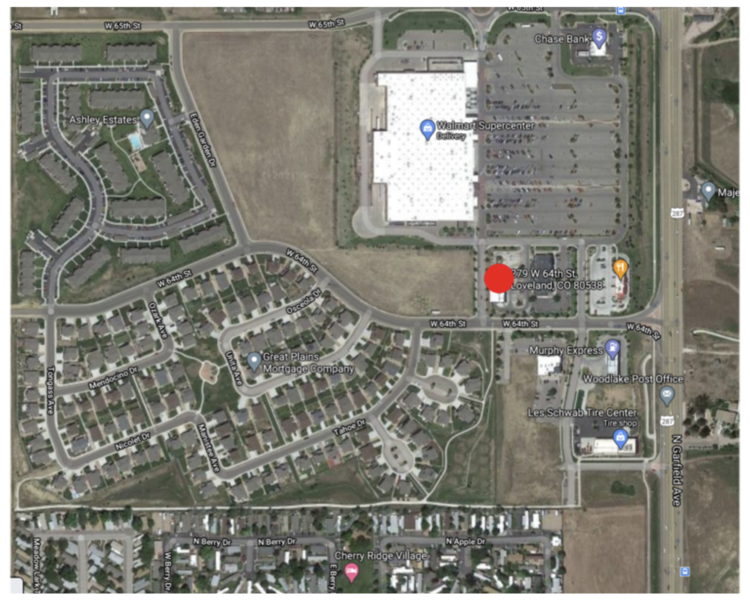
View of space in Loveland, CO. The red means high risk for fire even though it is not obvious by the surroundings.
As you can see neither appear to be particularly vulnerable to wildfire yet when we take into account multiple data streams such as historical event catalogs, early warning data streams, and forward looking climate projections plus other geoscience layers (such as burnable land index) the chance of a wildfire is calculated to be much higher in Loveland than in Oakland. This becomes even more clear when we look at the risk as a multi-decadal graph.
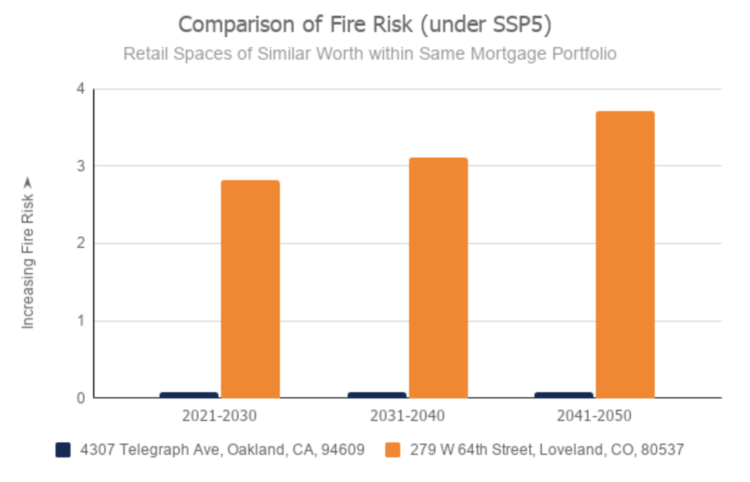
Using climate scenario SSP5 (the ‘Business as Usual’, 4 degree global warming scenario) we easily see increasing fire risk for the Loveland property compared to the one in Oakland.
Another case study - Durango, Colorado
Let’s now compare the Loveland property to another retail asset within the same portfolio, this time in the same state.
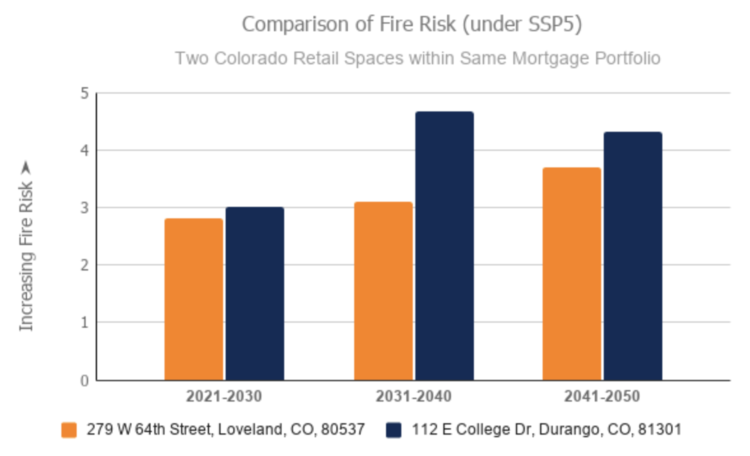
Comparing the Loveland property with another retail space in Durango, it becomes clear that although Loveland has a high risk for fire, the risk increases more significantly in Durango.
What does it all mean?
Imagine if you’re a real estate company in Colorado. Using this data, you can now explore and quantify:
How projections of future climate changes would affect the probability of default?
What are the climate-related potential losses from prepayment risk?
Which insurance products can ensure coverage for the most severe climate-related losses?
What kind of protective infrastructure could be built to avoid or lessen the cost of climate change?
What are possible opportunities for new climate-resilient real estate developments?
Climate is a complex network of factors. But with frontier climate models, earth observation data and cutting edge AI, at Sust we can transform complex climate science into transparent financial information. This new information can enable business and financial resilience for years to come.
If you find this material interesting and care about the changing climate, please forward to a friend or reach out.
*This is an example to illustrate a point and we do not have access to these location’s financials.