Our partnership with Yield Book: Towards climate-informed metrics in sustainable finance


Asset-level factors, including environmental, socio-economic, and weather-related disruptions, can significantly impact business operations. In recent years, the physical effects of climate change have become a significant concern for businesses, particularly electric utilities.
Catastrophic events like Hurricane Irma in 2017 can significantly damage electric utility grid infrastructure, including power stations. Irma led to more than $1 billion in damages to Florida-based utility NextEra Energy’s assets despite the company spending nearly $3 billion on a grid-hardening program. Frontier climate science tells us that such catastrophes are becoming more common. 2023 saw more than 1 billion dollars of inflation-adjusted climate events than any previous year in US history.
Counterintuitively, such disasters don’t always impact utility companies' bottom lines in the manner one might predict. NextEra’s stock price remained relatively unchanged before and after Irma made landfall as regulators acted quickly to cover damage costs and approve rate increases as expected by the market. Extreme events can even facilitate the growth of utility companies because capital expenditures from the companies to increase grid resilience to climate catastrophes can lead to regulatory approvals of rate increases.
However, not all extreme climate events leave utility companies unscathed. In New York, where hurricanes are less common, leaving company management teams and industry regulators less prepared to handle crises, NYC-based Consolidated Edison saw its stock price fall nearly 10% in the weeks following Hurricane Sandy in 2012. More recently, Hawaiian Electric saw its stock price fall almost 30% in the weeks following the Maui wildfires in August 2023.
Extreme climate events present a significant risk and investment opportunity for utility companies across the United States. It is crucial to understand how climate-related risks are expected to evolve at the asset level to analyze how the increasing impact of climate change could affect a utility company.
We present a knowledge graph-based approach to climate-related risks derived from frontier climate research and bottom-up site-level information on electric utility production. We demonstrate how combining these data can be used as new inputs for analyzing and constructing investment portfolios. We present an analysis of a passive utility sector ETF, XLU, as a representative portfolio composed of utility companies. Our analysis combines historical baselines for risk and impacts from climate-induced physical hazards and explores projected future climate risks and impacts over estimated portfolio hold times of these utilities.
Through our representative physical climate risk assessment workflow applied across large US electric utilities, the top 3: NextEra Energy, Southern Company, and Duke Energy holdings have significant aggregate baseline climate risk impacts. Climate risk impacts are expected to increase from baseline (today’s level) to projected impacts in 2030.
On sort ranking issuers based on the increased risk across the 2025-2035 projections benchmarked against the baseline, the top 5 issuers show an average of 56% increased risk impact from structural damage from acute climate-induced hazards.
The availability of detailed data provides a valuable opportunity to thoroughly understand how electricity production is influenced by various factors, especially those related to climate. Let's begin by examining the US utilities market, where a notable trend emerges among top utilities—they are spatially concentrated, with their generating capacity heavily focused on specific service areas, often limited to just one or two states.
Table 1: Top 10 US utility companies top 2 states % generation concentration.
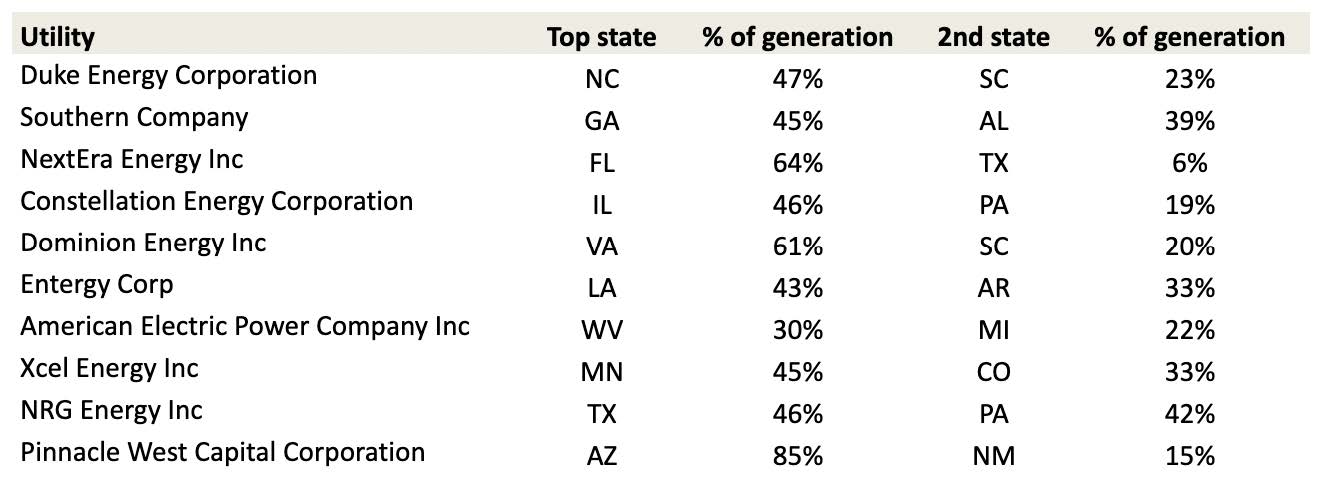
This concentration implies that utilities may encounter varying concentrations of risk depending on the geographic location of their power generation units.
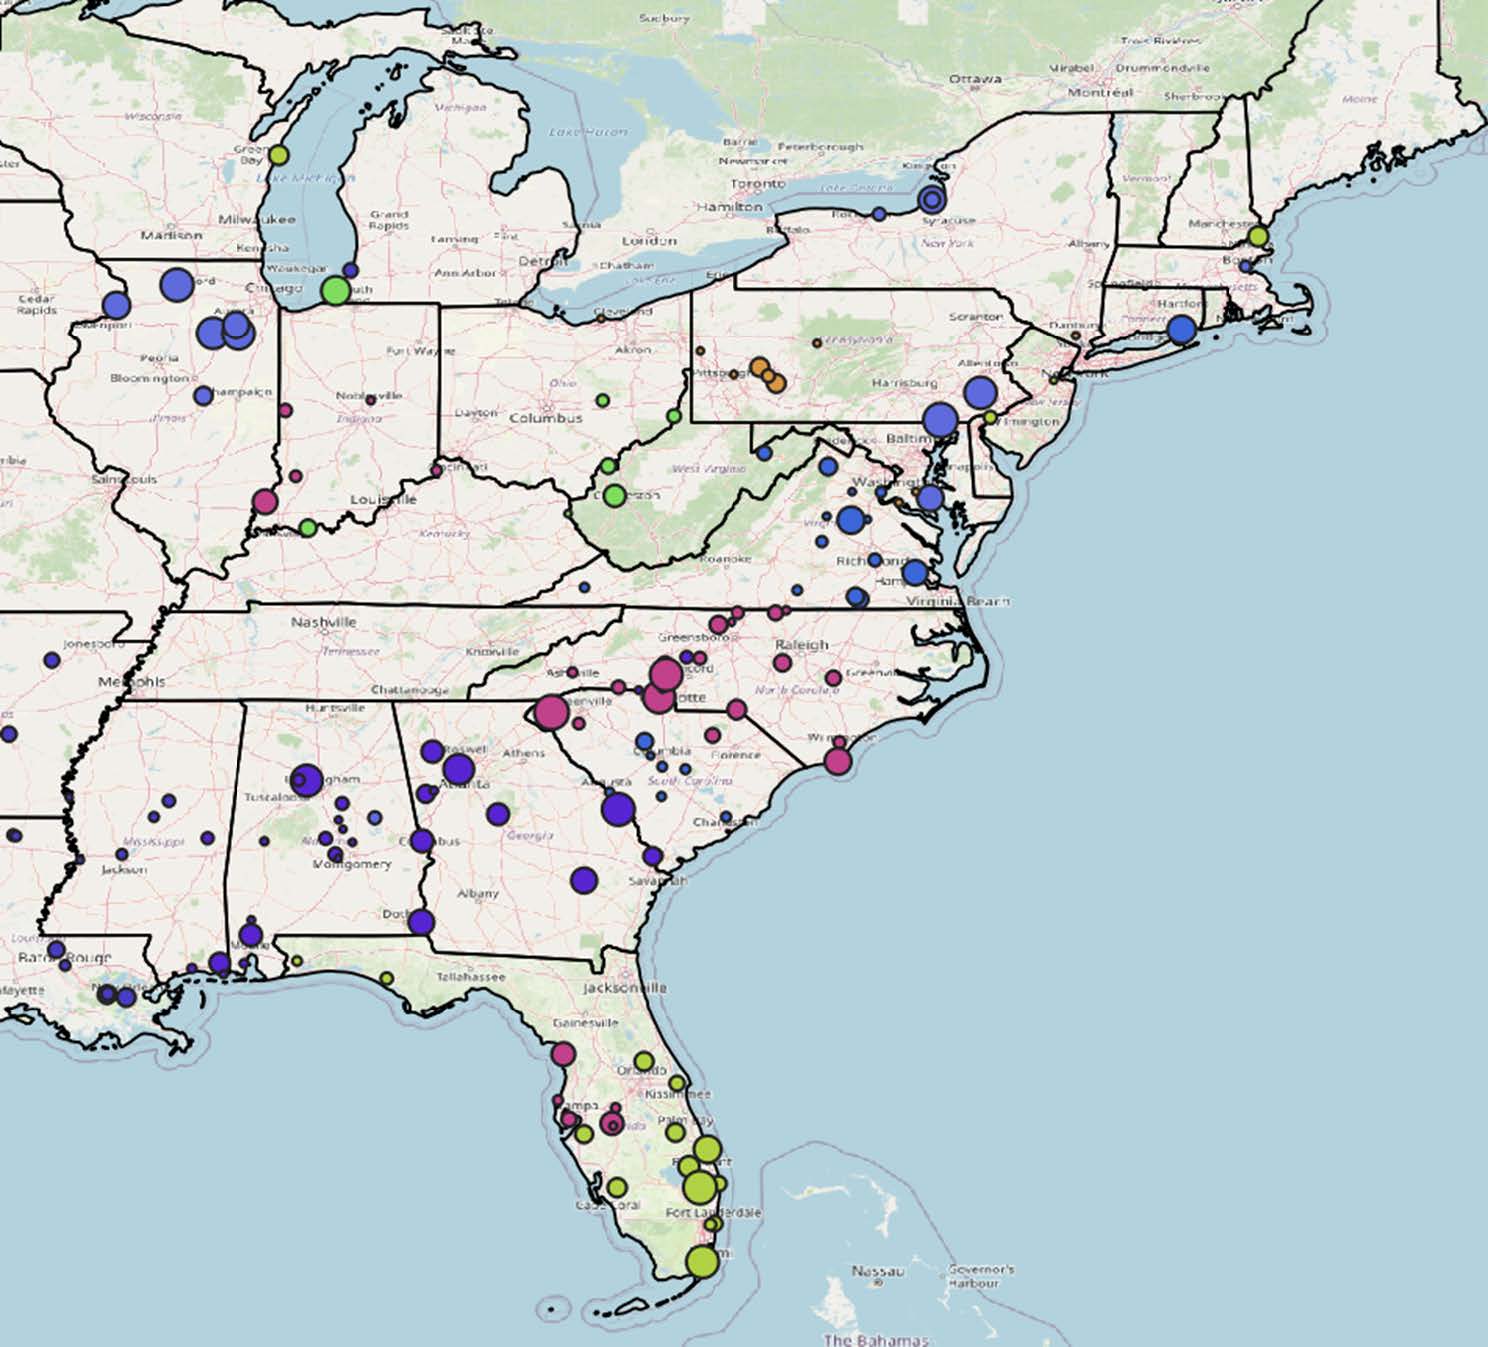
Figure 1: Spatial distribution of the power generation assets across the top 10 utilities. The size of the circle indicates the relative annual generation volume.
Now, delving deeper into the risk exposure of a major player, NextEra Energy. NextEra’s operating fleet of power stations in Florida is heavily skewed towards oil-based, carbon-intensive power generation.
Table 2: NextEra Generation capacity based on fuel sources
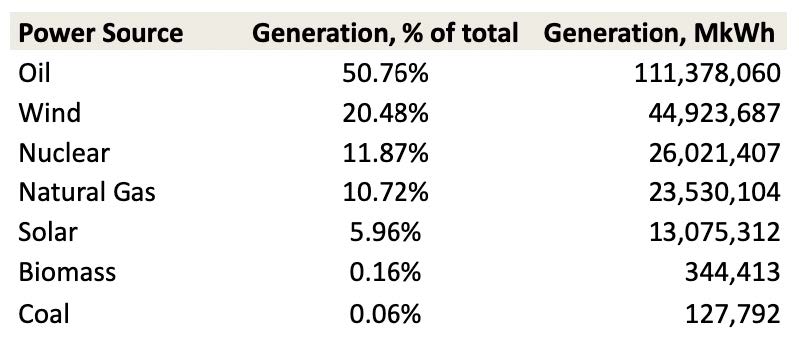
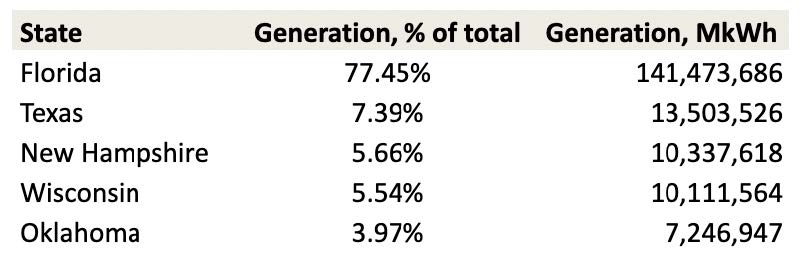
While NextEra operates nationwide, a substantial portion (64%) of its power generation is in Florida (see the table).
Table 3: NextEra Generation capacity based on state
We’ll examine the granular, site-level distribution of climate-related physical hazards covering wildfires, floods, and cyclones at the locations of the power-generating sites. Running asset-level risk assessments from physical hazards allows us to aggregate to the issuer or regional level. These hazard impact values are expressed as a fraction between 0.0 and 1.0, with 1.0 indicating maximum damage to the power-generating structure and its associated value.
Table 4 shows the aggregate baseline physical climate risk impact at different power generation sites sorted by baseline risk exposure.
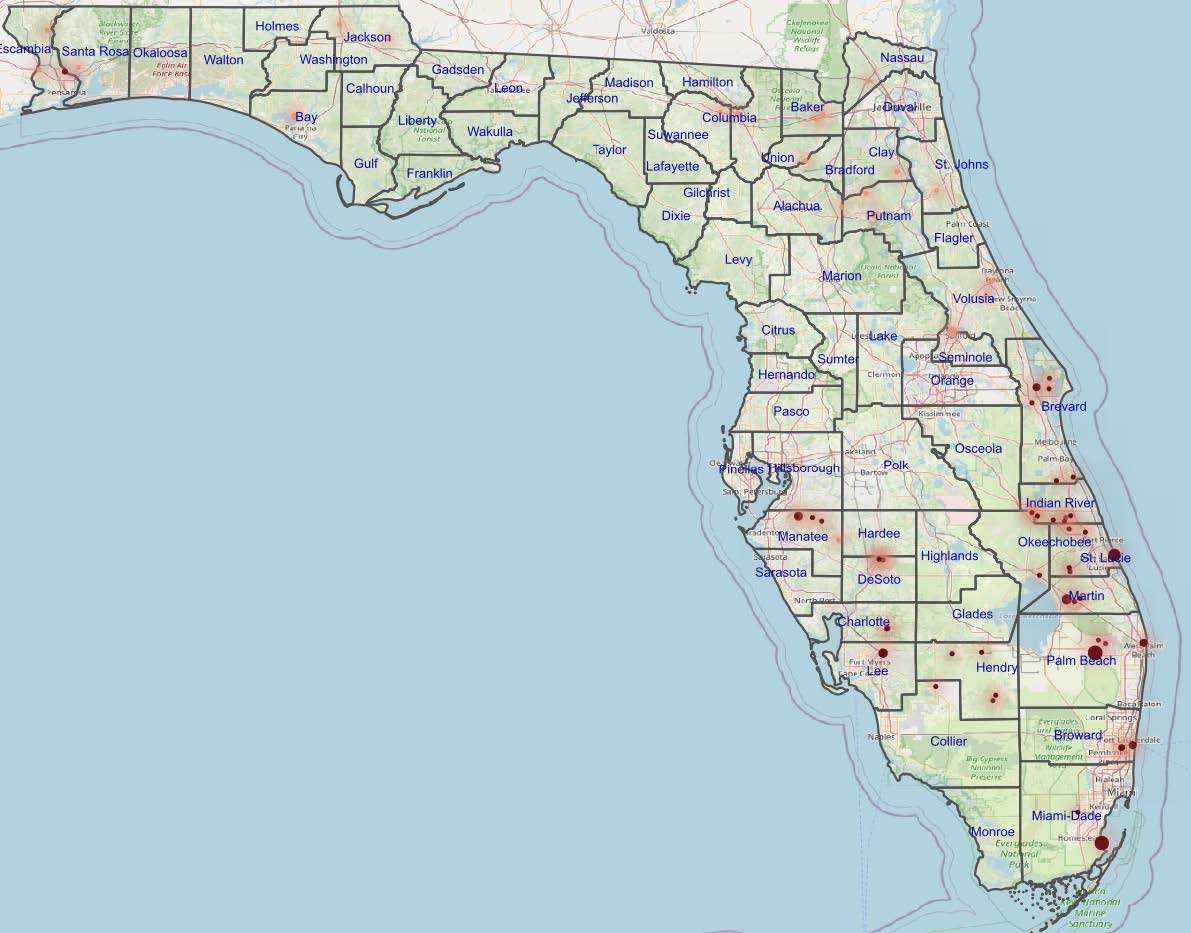
Figure 2: Map showing aggregate baseline physical climate risk impact at different power generation sites with color intensity as a function of baseline damage impact from physical risk exposure aggregated across wildfires, floods, and cyclones.
For this analysis, we use data from Sust Global that represents the total baseline risk as a measure of building damage.
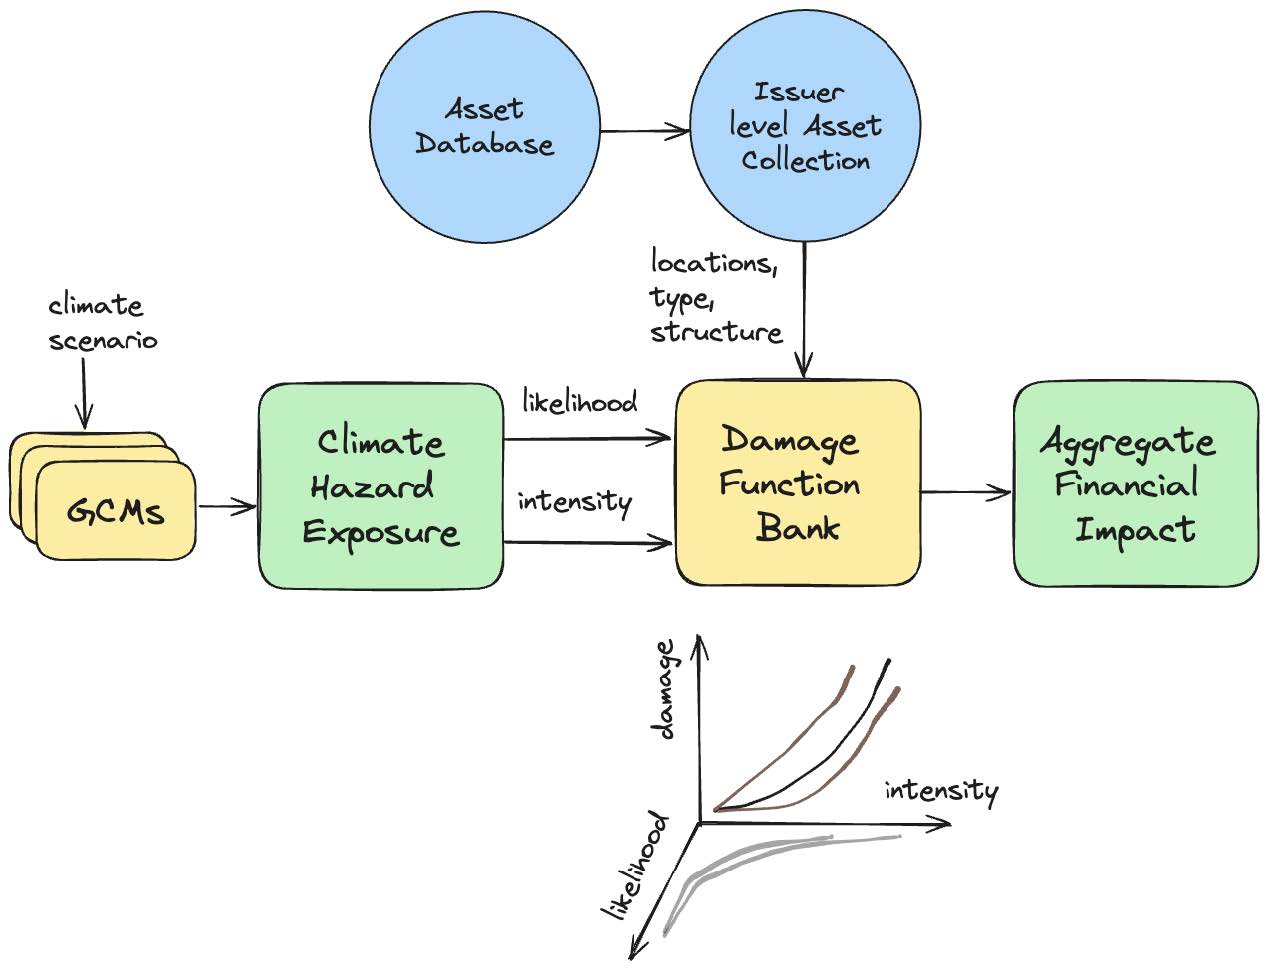
We start with risk exposure values derived from frontier climate models to calculate financial risk from physical climate hazards. These asset-level risk exposure values represent the annual exceedance probabilities (also known as Return Periods) for different hazard thresholds. For example, the risk data for inland and coastal flooding provides the probability of exceeding different inundation depths, with greater depths corresponding to low probability, high-cost events.
Next, we calculate expected structural damage by combining these exposure values with Intensity-Damage-Functions from the US Army Corps of Engineers. These functions (also known as impact functions or vulnerability curves) describe the expected damage to a given structure type for a given hazard intensity. For example, empirically, a flood of depth 1m can damage 20% of a structure’s total value for typical heavy industrial structures such as power stations and power distribution facilities, as the US Army Corps of Engineers reported.
To quantify total expected structural damage, we then aggregate the structural damage estimates for wildfire, inland flooding, coastal flooding, and tropical cyclones for each asset location associated with the individual issuer. These hazards account for most structural damage to buildings and critical utility infrastructure. We aggregate structural damage values across different hazards over a historical time window to create a total baseline damage score. For example, a value of 0.2 for aggregated baseline risk impact means physical climate hazards materially impact the building structure at 20% of the value of the building.
Figure 3: Computational flow to arrive at baseline and climate scenario-driven financial impact scores
Analyzing current and projected climate structural damage risk for specific NextEra locations reveals that electricity production facilities face substantial climate risk. Sites responsible for over 80% of electricity production (115M kWh) are located in areas where the climate risk exceeds the Florida average.
The primary risks to NextEra electricity production facilities include tropical cyclones (hurricanes), floods, and wildfires. Notably, almost three-quarters of power generation occurs on the Florida East Coast, where flood risks are anticipated to rise substantially due to increasing sea levels.
To quantify the long-term climate impacts on electricity-generating capacity, we multiply Sust Global’s impact scores by the value of site generation and divide it by the total generation of all company electricity-generating sites. This resulting set of metrics is referred to as the utility's current climate risk impact profile.
The climate risk impact profile provides an overview of the overall risk to the products produced by the utilities, considering the specifics of each production site and the relative contribution of different sources of physical climate risk. The climate risk impact profile covers tropical cyclones, inland and coastal flooding, and wildfire, the primary hazards of business interruption and damage. Additionally, the risk profile can be extended into the future by applying Sust Global’s risk impact scores over 30, 50, and 80-year windows.
By using the Sust Global climate risk impact profile, users can understand and quantify asset and company-level risks essential for informed decision-making in electricity production and future planning.
Applying the climate risk baseline scores from the asset level to the issuer level and aggregating them to the portfolio level creates additional input into the portfolio construction and analytics. We take the XLU ETF's example, deconstruct the constituent utilities' portfolio, and analyze their baseline risk impact profiles from physical climate risk. We use a two-set process for the analysis:
We assess the physical climate risk impacts from three acute hazards: wildfires, flooding, and tropical cyclones at each owned asset (power station and distribution sites) associated with each issuer.
We aggregate the climate risk to a total baseline risk impact score at the asset level.
We aggregate the total baseline risk impact score over all the assets within an issuer. For the sake of simplicity, we use an unweighted average across the baseline risk impact scores for all assets an issuer owns.
Table 5: Climate Risk Profile for all XLU holdings, XLU composition, and weights are as of September 2023. This table is generated by weighting the asset level annual power generation (based on reported numbers) by Sust Global’s multi-hazard climate impact scores and aggregating it to the issuer level, estimated over three-time windows: baseline, 2030, and 2050.
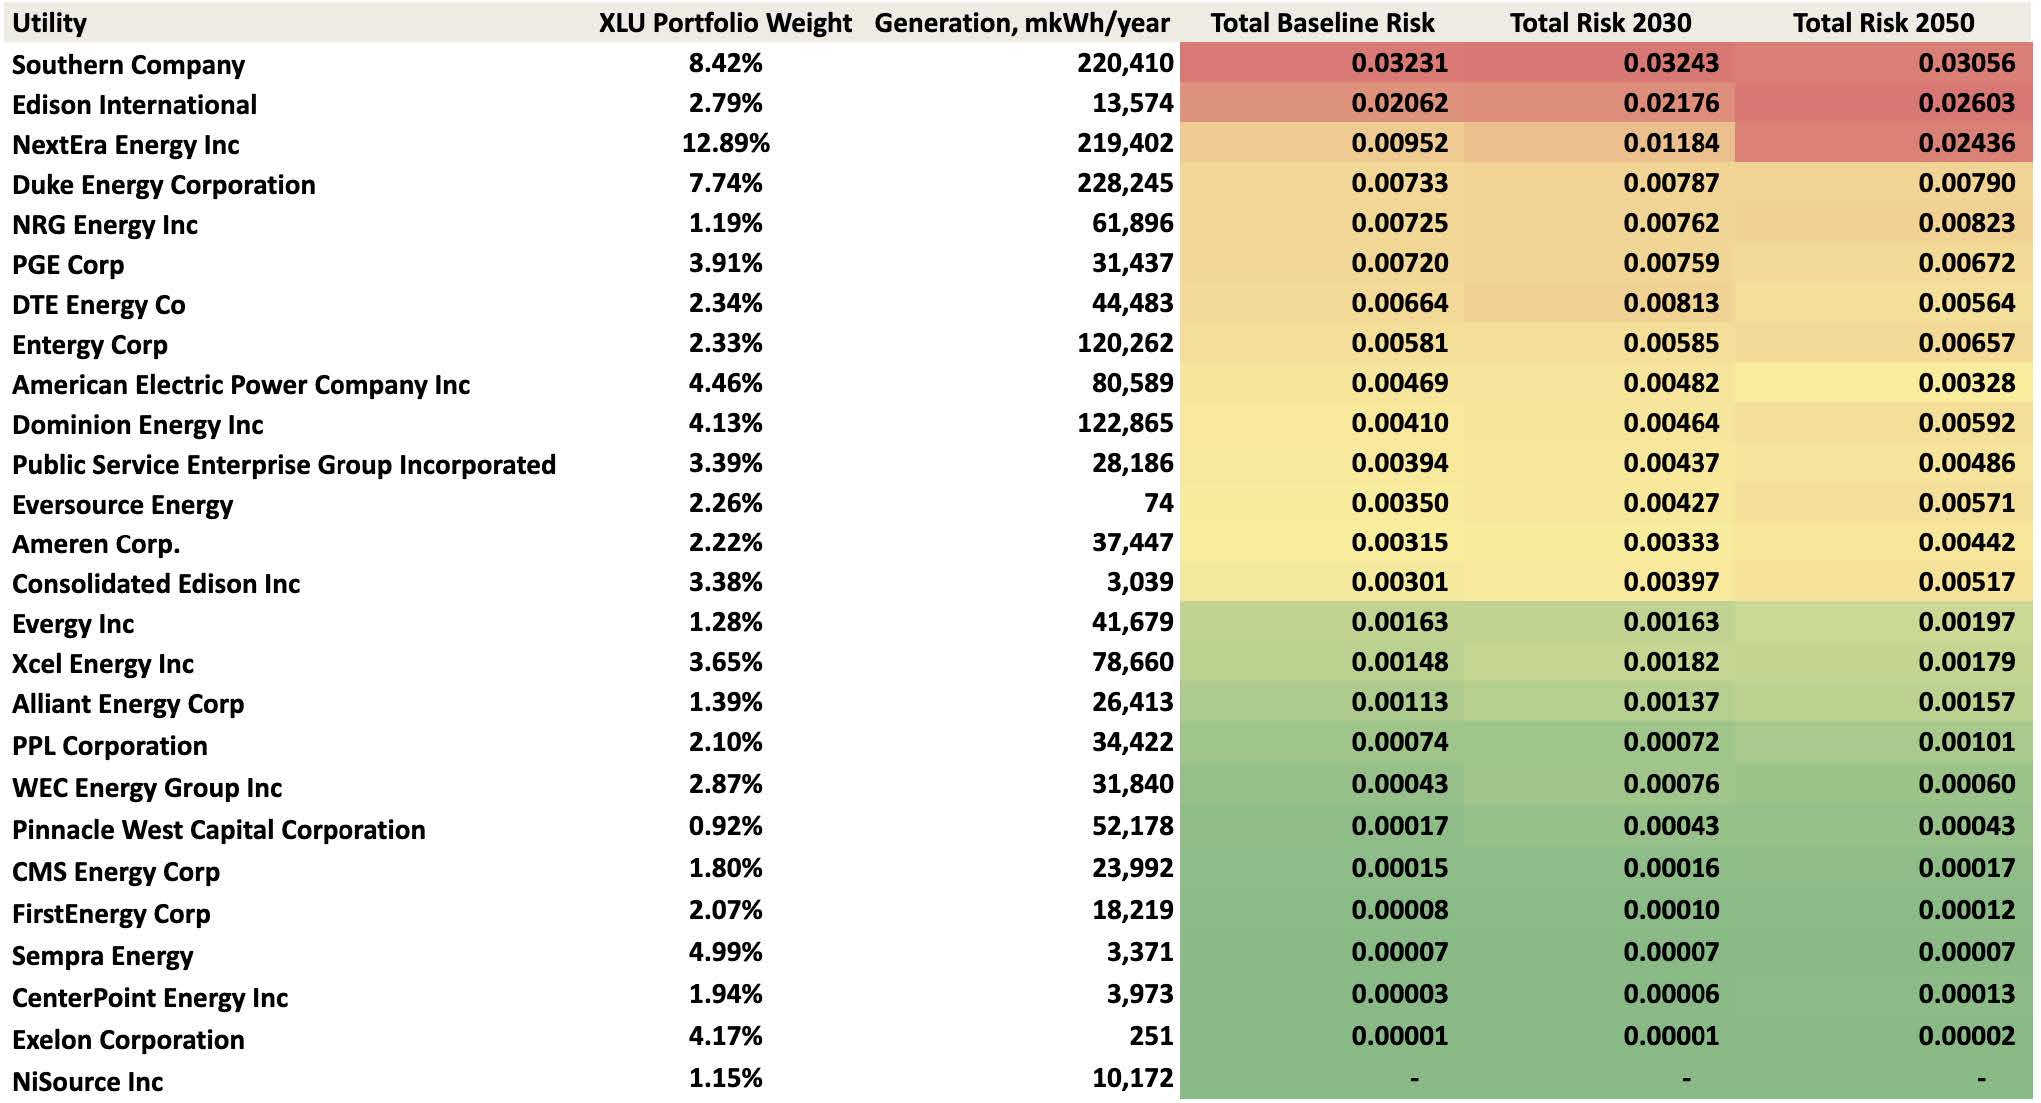
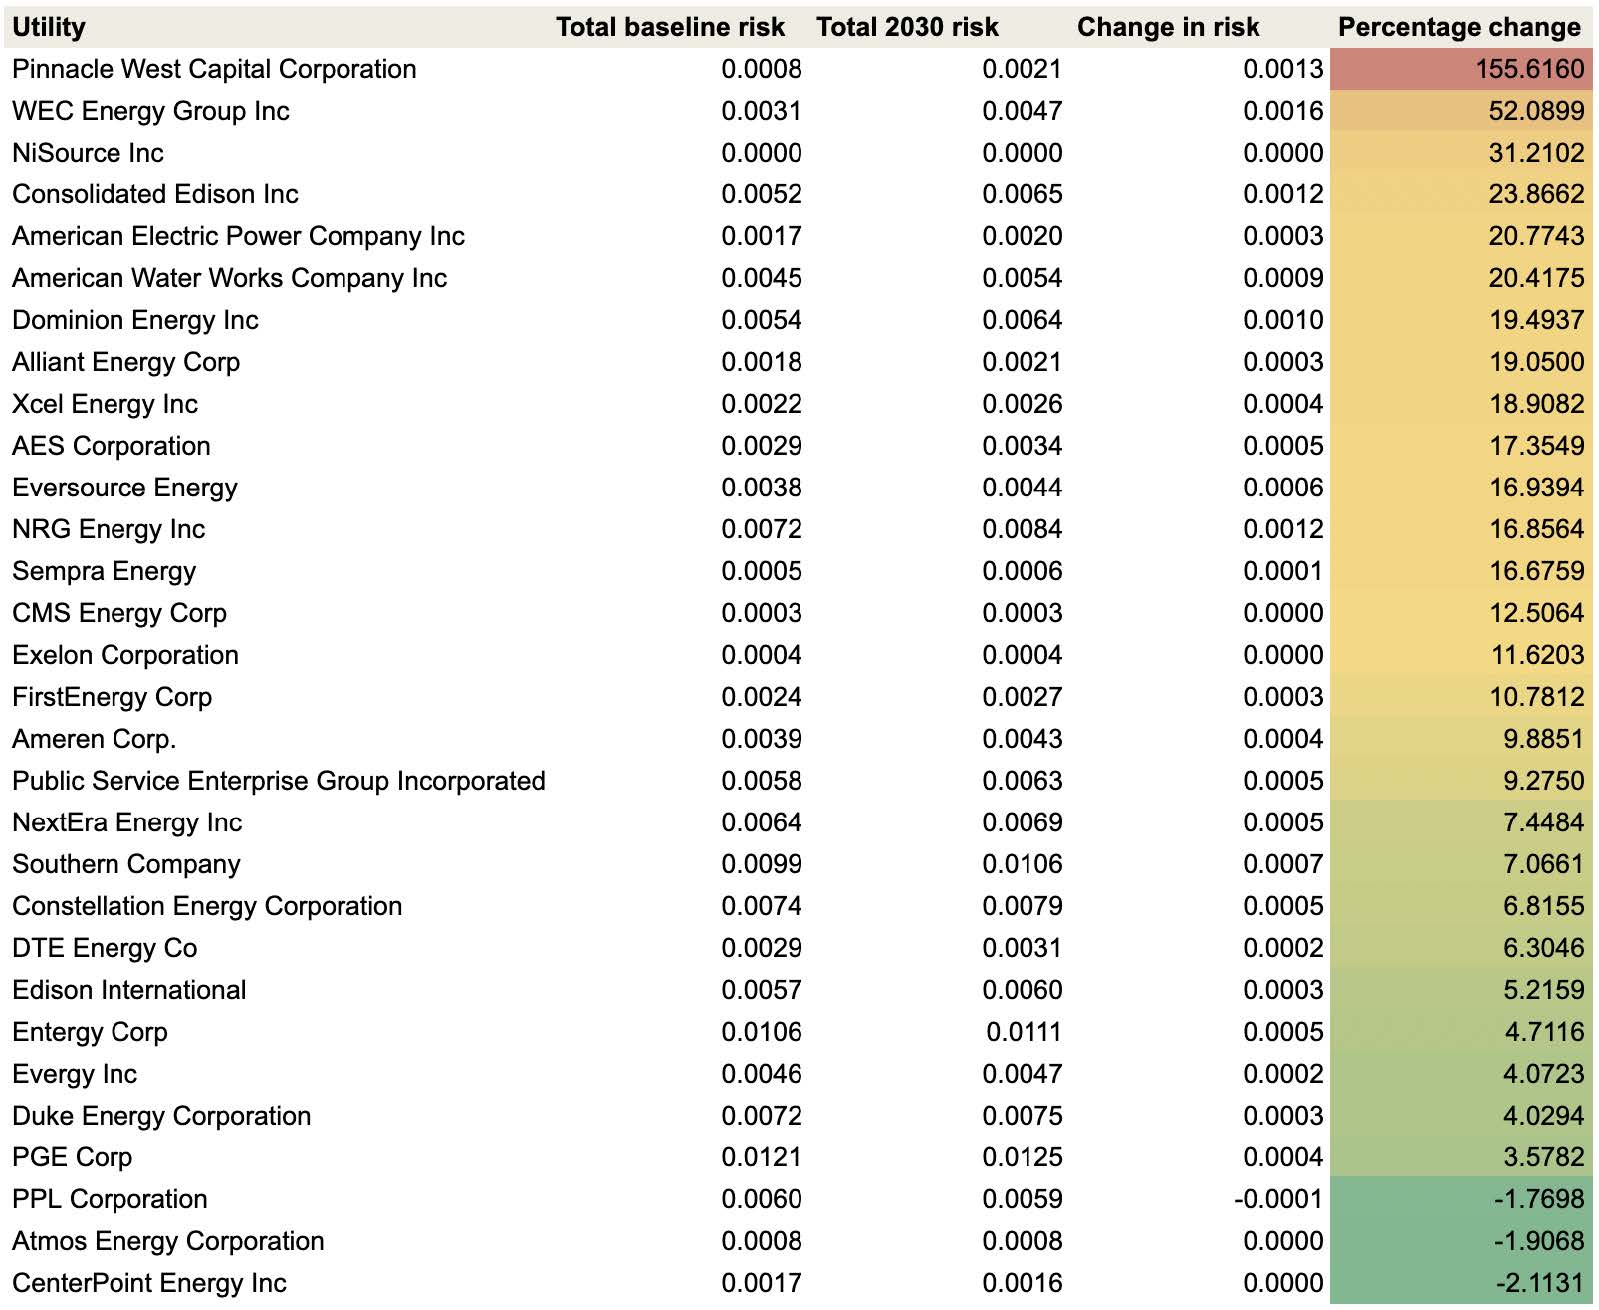
Table 6: Climate Risk Profile for all XLU holdings, XLU composition, and weights are as of September 2023. Profile comparisons across baseline and 2030 projections based on climate risk impacts.
From our analysis, we make the observations:
As seen in the tables above, there is a significant divergence in baseline climate risk across the different constituents in the ETF. While some constituents like NiSource and Pinnacle West Capital Corporation have very low baseline climate risk impact scores, utilities like Southern Company and Edison International have significantly higher baseline climate risk scores.
Being a passively managed portfolio, the top 3 holdings in the XLU ETF, NextEra Energy, Southern Company, and Duke Energy Corporation, make up over a quarter of XLU’s value and have significantly higher baseline climate risk impact scores than the rest of the holdings in the ETF, reflective of weighting based on the market capitalization of each of these companies.
Across the Issuers with the top 3 weightings in XLU, NextEra Energy, Southern Company, and Duke Energy holdings, we see high aggregate baseline climate risk impact scores and an increase from baseline risk to projected risk impacts in 2030 (Table 5).
We sort ranked issuers based on the increased risk across the 2025-2035 projections benchmarked against the baseline. In that case, the top 5 issuers show an average of 56% increased risk impact from structural damage from acute climate-induced hazards (Table 6).
This analysis showcases an additional factor of risk to consider when considering constituent issuers in the ETF portfolio allocation, and this representative analysis showcases an approach to how such risk considerations can be factored and evaluated.
We introduce two emerging spatial-level data layers in this analysis. A dataset representing physical asset locations, function, and ownership, and a dataset representing physical climate risk impact at the asset level, which, when combined, yields portfolio-level insights that were previously extremely difficult to achieve.
We showcase a workflow to analyze and profile the climate risk impacts at the issuer and portfolio levels. We present an analysis of a passive utilities sector ETF, XLU, as a representative portfolio of utility companies. While the example presented for the workflow is one of a passively managed ETF, this approach can also be applied to actively managed portfolios and include both baseline and forward-looking climate risk impact projections. While the presented example is based on a bottom-up analysis across power generation sites, the approach can be extended to include power distribution networks, transmission lines, and other tangible assets.
Figure 4: Physical climate risk workflow applied to utilities in XLU, enabling clear identification of companies with significant present day (baseline risk impacts) (Known High climate risk) and those with low present day(baseline) climate risk impact but increasing future climate risk impacts (Hidden Climate Risk).
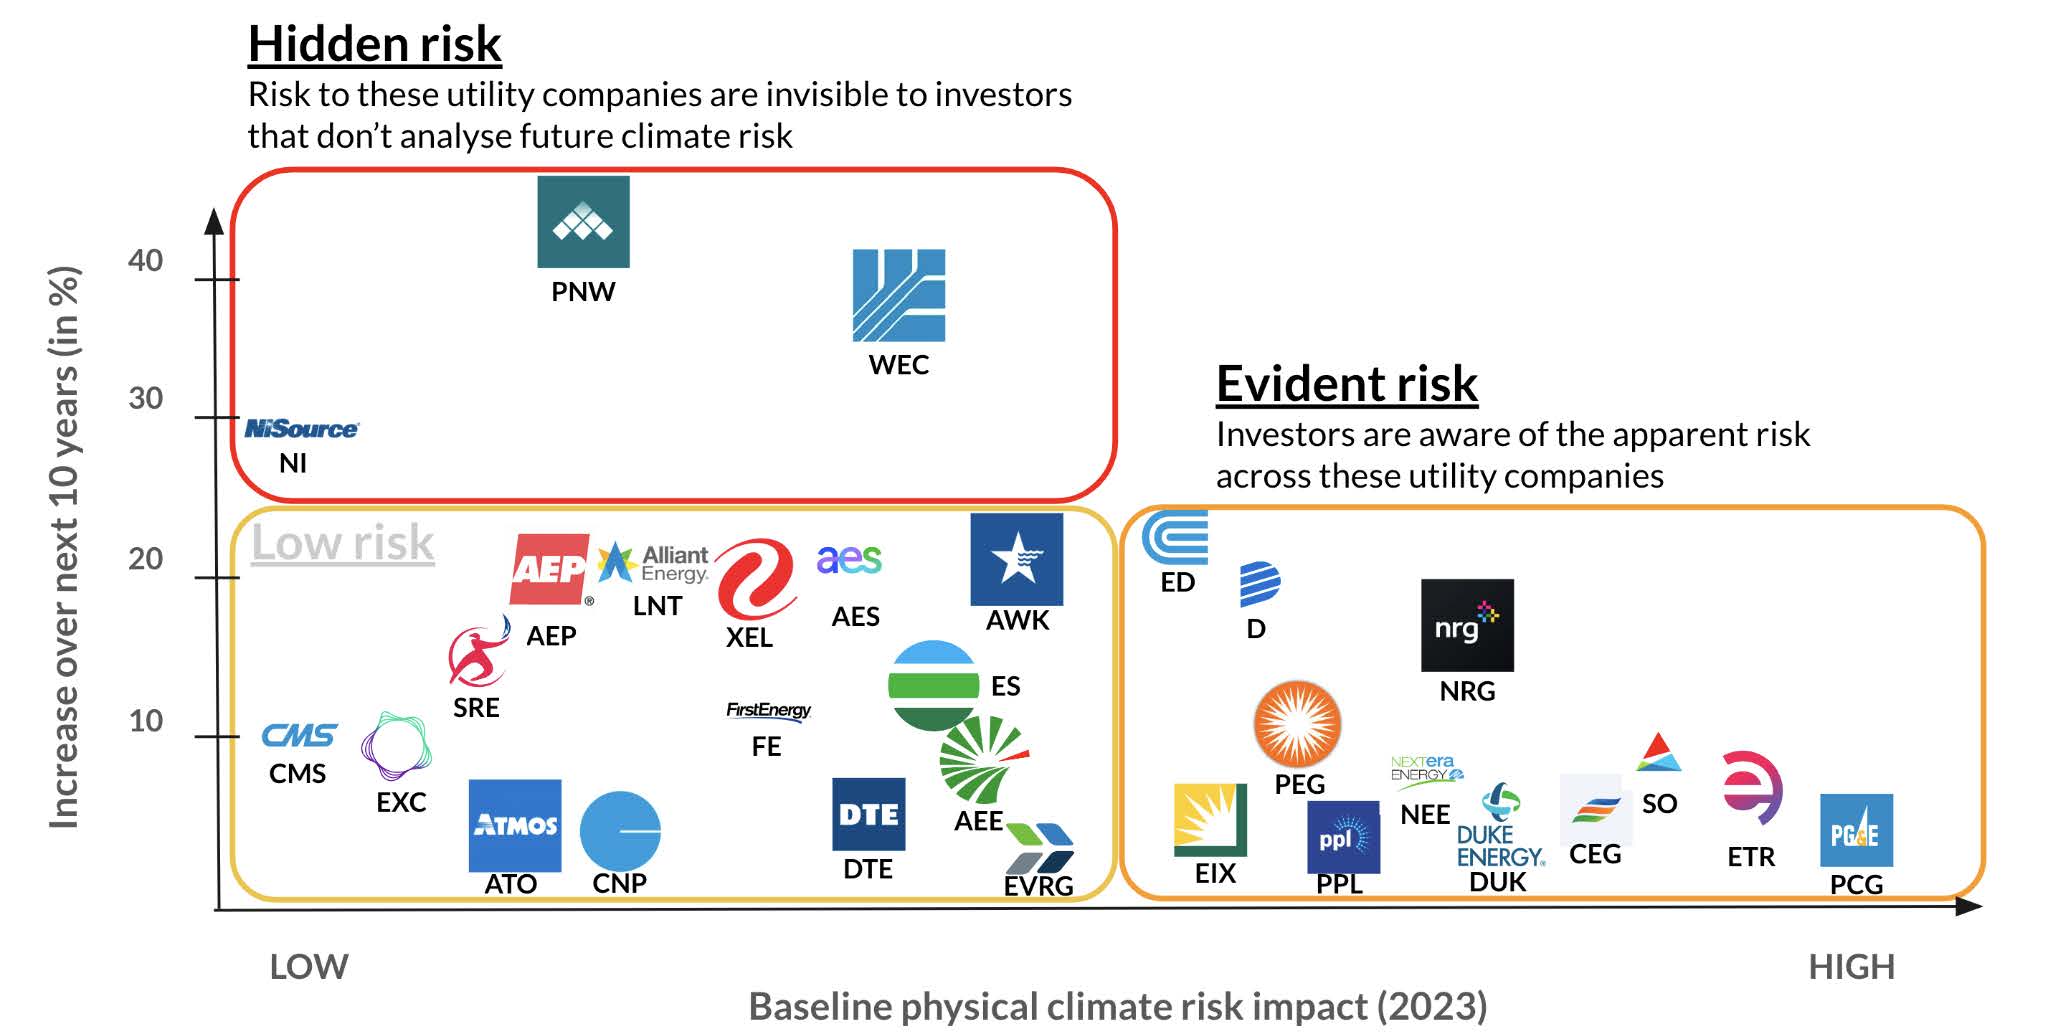
On mapping the analyzed utilities across two dimensions, present day (baseline) climate risk impact scoring and percentage increase over the next decade, we are able to identify the utilities with companies with significant present day baseline risk impacts, these are issuers with known high risk from extreme climate events. We can also clearly identify those with low present day (baseline) climate risk impact but increasing projected future climate risk impacts, issuers with hidden climate risk impacts (tickers in Figure 4).
Using a knowledge graph-based approach, equity research and portfolio management teams can:
Identify concentrations of past (baseline) climate-related risks at the issuer level.
Study correlations between electric utilities' financial performance and baseline climate-related risk impact at the issuer level.
Identify future concentrations of climate-related risks to portfolios of issuers over near-term (12-36 months) and long-term (5+ year) windows.
Evaluate the weighting of issuers across the portfolio by accounting for climate risk as an additional risk factor.
Finally, the ability to leverage a single turn-key publishing solution that can quickly yield insights significantly eliminates the time and costs of data onboarding and preparation to conduct the analysis.
While this is one representative workflow, we present these datasets and the workflow components as composable building blocks for portfolio analysis and portfolio construction based on the goals and motivations of the portfolio manager and the investment analyst.
Contact us to learn more about how you can use this reference dataset to analyze your electric utility holdings and research your current and future financial impacts from physical climate risks.
Authors
Gopal Erinjippurath is the founder, CTO, and Head of Product at Sust Global, where his team is building generative AI-powered data and analytics for planetary-scale climate resilience. Most recently, he led the Analytics and Insights product team at Planet Labs (NYSE: PL), an integrated aerospace and data analytics company. He has been a speaker at global industry conferences, including Google Cloud Next and MLConf, and leading AI conferences such as CVPR (2018), ICML (2019), NeurIPS (2020, 2022), and ICLR (2023).
Alex Vengerovsky is the founder and Chief Data Scientist at Spatial Risk Systems (SRS). Previously, he led the Strategic Sourcing function at Bridgewater Associates, the world's largest hedge fund, overseeing relationships with market data providers, research content, and technology services. Before that, he worked as a technology manager and director of application development at Morgan Stanley, Dun & Bradstreet, and Merrill Lynch.
References
Why, and how, utilities should start to manage climate-change risk, McKinsey Insight, 2019 (link)
Billion-Dollar Weather and Climate Disasters, National Centers for Environmental Information, 2023 (link)
Consolidated Edison Stock Price, Yahoo! Finance, 2024 (link)
Hawaiian Electric shares drop further as S&P downgrades utility to junk, Caroline Valetkevitch & Herbert Lash, Reuters, 2023 (link)
Asset-level assessment of climate physical risk matters for adaptation finance, Giacomo Bressan, March 2022 (link)
The utilities sector sector SPDR fund (XLU), State Street Global Advisors, 2024 (link)
SRS Spatial Graph Datasets, Spatial Risk Systems, 2024 (link)
Sust Global Developers Center, Sust Global, 2024 (link)
Sust Global Financial Risk Analysis, Sust Global, 2024 (link)
Climate Change: Managing the Financial Risk and Funding the Transition – Chapter 14, Jing Zhang, Risk Books, 2022 (link)
This article was written by Sust Global and SRS, A Spatial Knowledge Graph Company, which tracks physical assets and asset owners, along with the key measures of those physical assets. Helping investors and underwriters fully evaluate asset owners from the ground up.
Superscript
[1] Why, and how, utilities should start to manage climate-change risk, McKinsey Insight, 2019 (link)
[2] Billion-Dollar Weather and Climate Disasters, National Centers for Environmental Information, 2023 (link)
[3] Consolidated Edison Stock Price, Yahoo! Finance, 2024, (link)
[4] Hawaiian Electric shares drop further as S&P downgrades utility to junk, Caroline Valetkevitch & Herbert Lash, Reuters, 2023 (link)
[5] Asset-level assessment of climate physical risk matters for adaptation finance, Giacomo Bressan, March 2022 (link)
[6] The utilities sector sector SPDR fund (XLU), State Street Global Advisors (link)
[7] SRS Spatial Graph Datasets, Spatial Risk Systems, 2024, (link)
[8] Sust Global Developers Center, Sust Global, 2023 (link)
[9] Sust Global Financial Risk Analysis, Sust Global, 2023 (link)
[10] Climate Change: Managing the Financial Risk and Funding the Transition – Chapter 14, Jing Zhang, Risk Books (link)


We use cookies to give you the best online experience. Please let us know if you agree to all of these cookies.