Wildfire risk: predicting an unusual future?
The devastating consequences of this are felt in every continent. Analysis from the UN Environment Programme’s Frontiers 2022 report shows that, between 2002 to 2016, 423 million hectares of the earth’s land surface burned annually. A related analysis also estimated that over 13 million individual fires occurred globally from 2003 to 2016, each lasting 4-5 days on average.
However, higher temperatures driven by climate change are not the only cause of increased fire risk: conditions on the ground also play a critical role. Fires don’t occur in a sandy desert, the middle of a lake, or a concrete urban area. The right combination of burnable vegetation on the ground and warm dry weather need to be present to spark a truly devastating blaze.
Estimating true fire risk requires the analysis of multiple complex data points that together explain how weather, biomass, and other factors interact. As climate change generates increasingly novel weather conditions, historical data is no longer a reliable indicator of fire risk in the future. Across the world, we’ve never seen rainforests this dry or savannahs this wet. This is why “global warming” might also be characterized as “global weirding” - everything will be stranger in the climate future we are creating.
This “global weirding” creates unique modeling challenges: this blog will set out how the data scientists at Sust Global are focused on solving them.
Table of contents
A brief history of the past
Historically, fire risk has largely been determined by a location’s biome. A biome is a categorization of land cover and species that are present in a certain area. For example, deserts, rainforests, and arctic tundra are all examples of terrestrial biomes. Rainfall level is one of the most important factors in determining a location’s biome, and thus its fire risk.
To show how biomes relate to fire risk, the picture below illustrates different biomes along an increasing gradient from extremely wet rainforests, through drier woodlands and savannahs, to chaparral and desert.
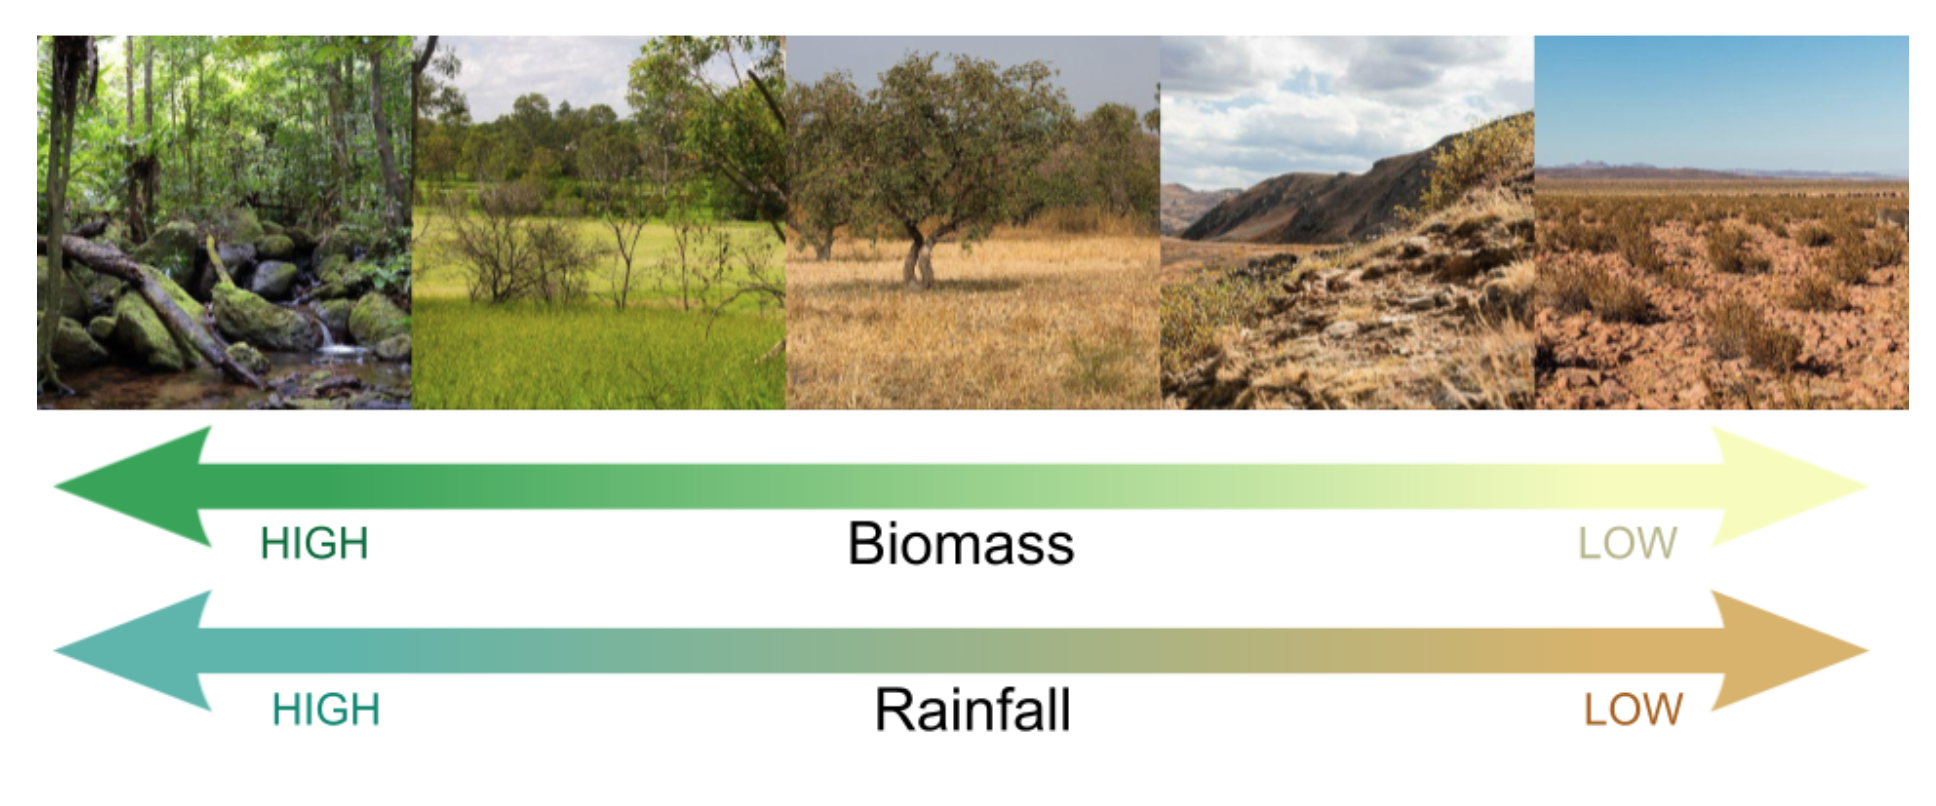 Types of vegetation communities along a rainfall gradient from very high (left), to very low (right). This rainfall gradient corresponds very closely to biomass levels, with most fire occurring in the middle.
Under a stable climate, you can tell a lot about the weather to expect in a location based on the vegetation communities. High-biomass rainforests (as pictured on the left) are located in areas with high amounts of year-round rainfall. Far above the soggy forest floor, the sky is usually filled with thick clouds. On the right, low-biomass deserts have very little rainfall, with bright, dry skies above, and rare, infrequent rain events.
Given that vegetation and rainfall are linked, you can also tell a lot about fire risk by looking at the biome in a location. Most fires occur in a habitable zone of precipitation. Go too far to either side of the precipitation/biomass gradient, and there will be either too much moisture for fires to be possible, or too little biomass for anything to burn. But biomes in the middle - e.g. open woodlands, savannahs, and chaparral - possess enough vegetation to be fuel for fire while also dry enough to create potential fire conditions.
This assumes a strong connection between precipitation and vegetation, which is the case under a stable climate: the types of plant communities found in an area are closely shaped by prevailing climate conditions. The dryness of an area limits the amount of biomass that can accumulate, with wildfire playing an important role in occasionally clearing out the excess biomass.
But under “global weirding,” that connection will be increasingly decoupled: deserts will likely become wetter and rainier, and parched rainforests will not get the levels of precipitation that previously sustained thick vegetation. In other areas, the timing of rainfall will shift: monsoons will come late, and wet seasons will come early.
While the figure above shows conditions under a stable climate, the figure below shows what happens when rainfall and biomass decouple. Suddenly it is possible for areas to have very low levels of rainfall with high biomass levels. You can see this in the record-breaking Amazon rainforest wildfires, where dense rainforest biomass is intersecting with unnaturally dry conditions. Similarly, the woody California chaparral has been seeing the worst drought in 1,200 years, with precipitation levels more typical of bare desert. These are areas where 20th century biomass is getting exposed to 21st century levels of drought, presenting a large risk of extreme future fires, as well as a significant modeling challenge.
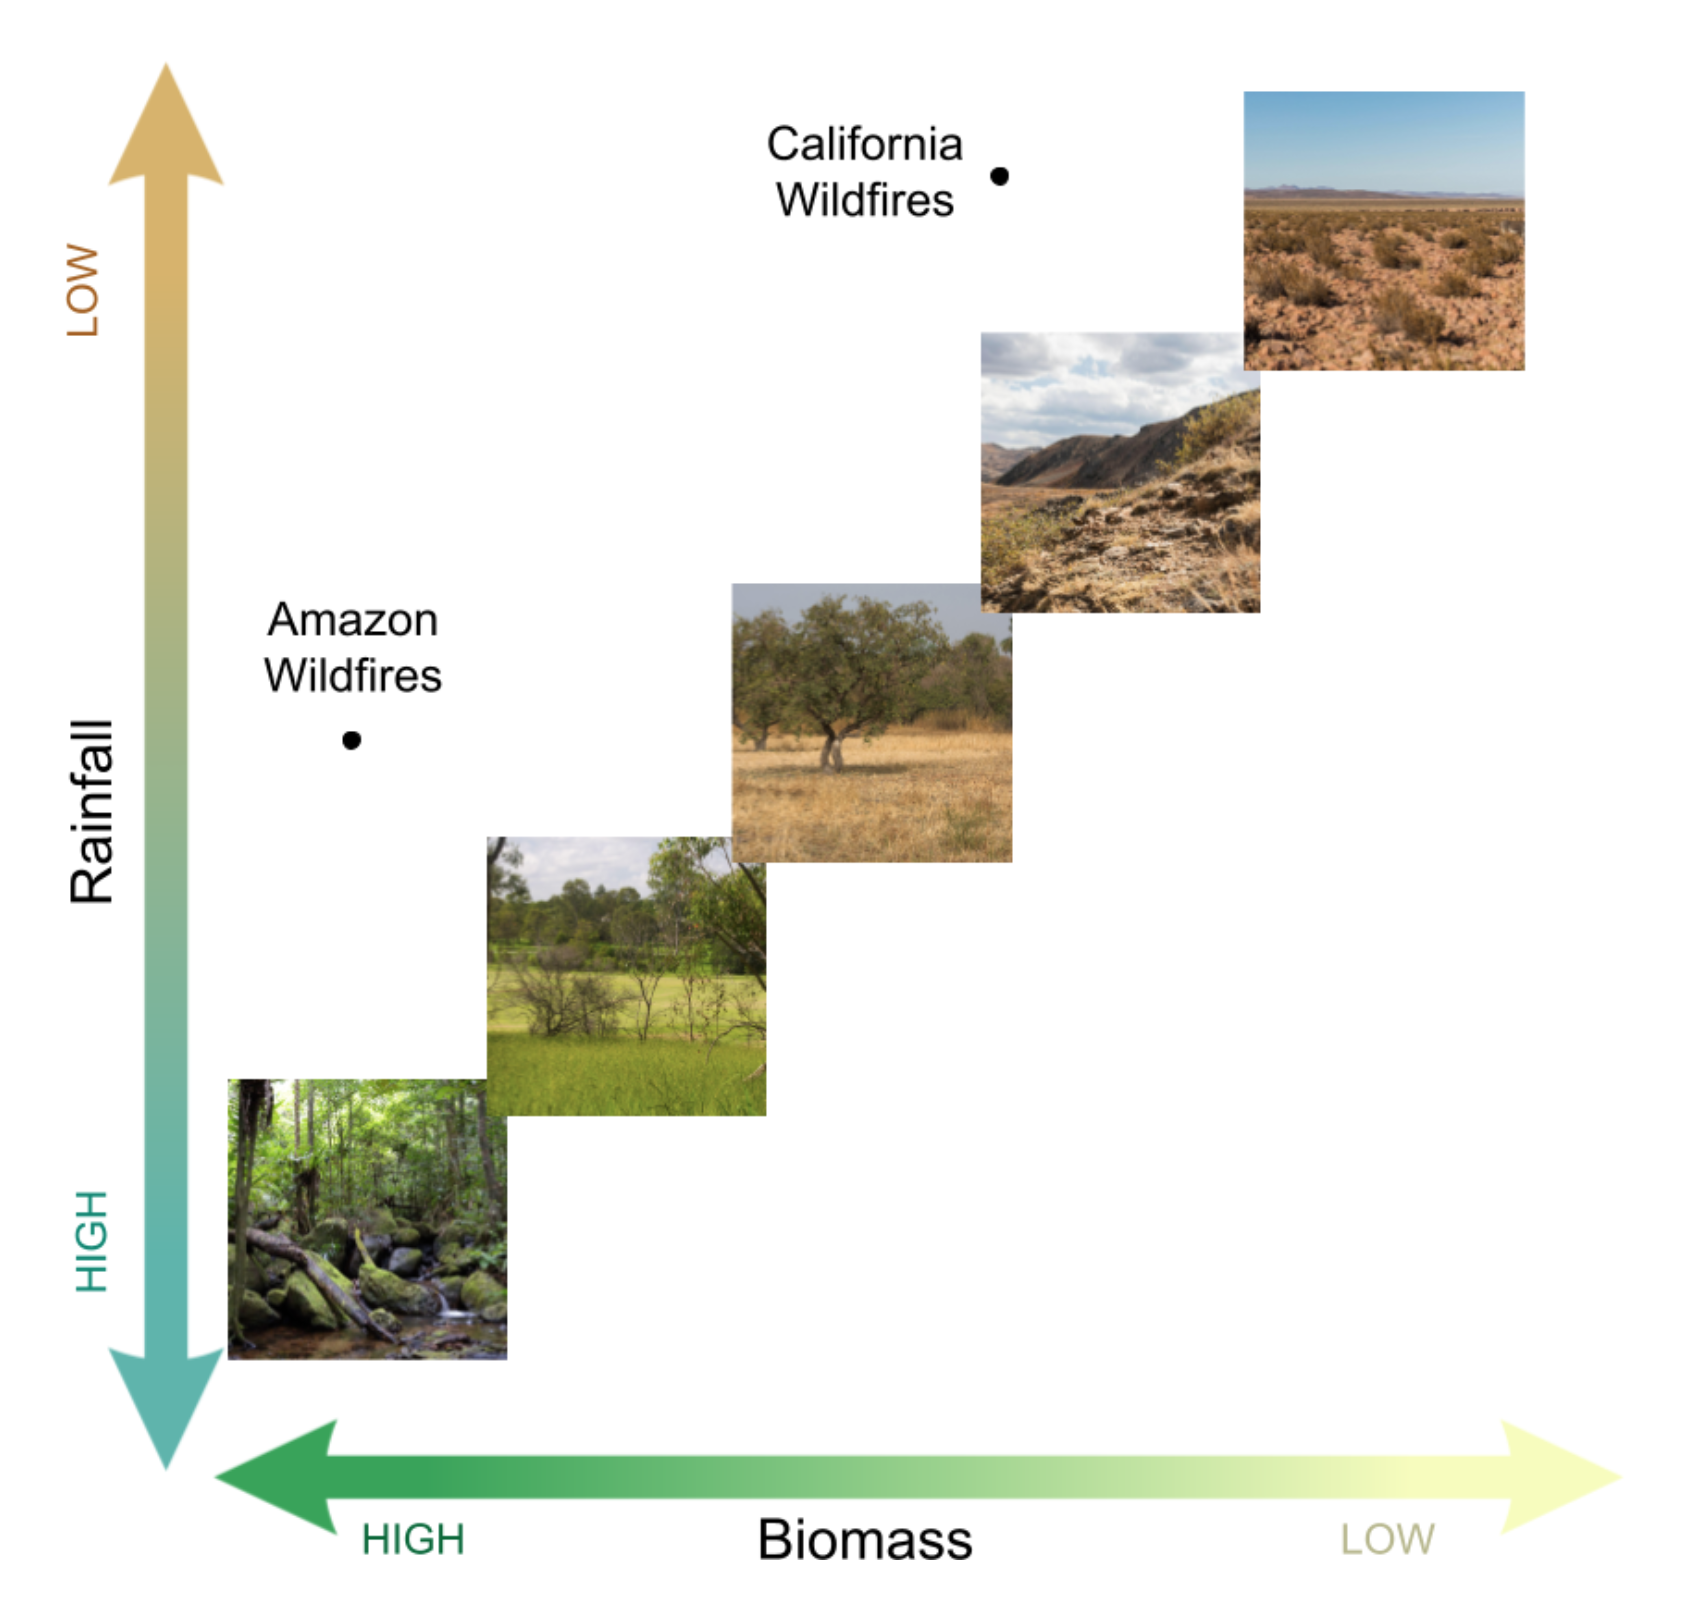
Decoupling of rainfall and biomass levels under climate change. In areas along the diagonal, biomass is proportional to rainfall. However, as precipitation levels shift, terrestrial landscapes will increasingly be located off the diagonal, and areas with excess biomass will see extreme wildfires.
Past risk exposure are no indication of future risk exposure
Quantitative approaches to risk management often assume that the past is a guide to the future. In most cases, this is a reasonable approach: Insurance companies estimate the risk of catastrophe by assuming that historic frequencies tell us something about future risks. For example: if there were two 5.0-magnitude earthquakes in the past hundred years, earthquake insurance that assumes a 2% annual chance of 5.0-magnitude earthquake may be offered. Whole subfields of actuarial science, and large statistical and catastrophe modeling teams at reinsurance companies operate under the assumption that statistics about the past are a meaningful guide to the future.
This approach no longer works for climate induced weather-related disasters: floods, hurricanes and wildfires will change in frequency and severity. Areas with previously occasional grass fires are starting to see catastrophic, tree-torching events. Hurricanes and Typhoons are making landfalls far north of where they normally stray, in places like Canada and Alaska. And what used to be 1000-year floods are occurring with improbable frequency. This makes it very challenging to accurately predict the future risk of these disasters.
In the case of wildfires, much of the change in severity will come from the disrupted connection between precipitation and vegetation. This explains the devastating wildfires in the Amazon Rainforest which have been largely driven by extremely low levels of rainfall. Similarly, the American West has been experiencing its worst megadrought in the 1200 years, which has been associated with record-breaking wildfires. Similar patterns of drying and increasing fire intensity around the globe are why the UNEP is predicting increases in “extraordinary” and “uncontrollable” wildfires.
Much of the framing around these unprecedented fires focuses on drought - anomalously low rainfall. Another framing is that these very low levels of precipitation are not “anomalous” in the sense that they are lower than normal - rather, they are the new normal. As typical rainfall levels shift, vegetation communities will change. Parts of the Amazon rainforest will become savanna, while parts of California’s scrubland will become bare desert. In the process of these changes, a lot of excess biomass will be burned as wildfire.
Dry, hot, fire weather will hit areas that have never previously seen values so extreme, which poses a significant modeling challenge. Using historic data within a given range to predict future data in the same range is straightforward. But future fire weather will be well outside what has been historically observed, beyond what data scientists call a model's “feature space”.
The KBDI fire weather index, is a reference scale that combines rainfall, temperature, and recent soil wetness to estimate fire risk, and ranges from 0 (no fire risk) to 200 (perfect fire weather). Historic observations of KBDI and fire occurrence in a given biome can be assessed to estimate fire risk.
For example, we can say that in Colorado’s grasslands, when the KBDI fire weather index is 0, there is no risk of fire, because we have never seen a fire when the KBDI is 0. But, when that value reaches 75 there has historically been a moderate risk of fire. For example, say the KBDI value has reached 75 on at least 20 separate occasions in a state park, and one of those times, there was a wildfire in the park.
We could then say that a KBDI of 75 is associated with a 1-in-20, or 5% chance of fire. But what about 125, or 150 - levels of fire weather we’ve never before seen in Colorado? We know that the risk will almost certainly be higher - but how much higher, and how much further will the fires spread when the fire weather index reaches new levels?
This is a challenge when trying to estimate future fire risk, as climate models say we will soon see unprecedented levels of fire weather around the world. For example, the figure below shows the distribution of KBDI values within the predominant biomes of four states. In all four states, fire weather will become much more common - to a degree never before seen in the historic record.
It is clear that the risk will increase, but specific predictions are harder to interpret: for example, how much will the probability increase? Which states will be more affected than others by wildfires resulting from the changing climate? Which types of properties are most at risk?
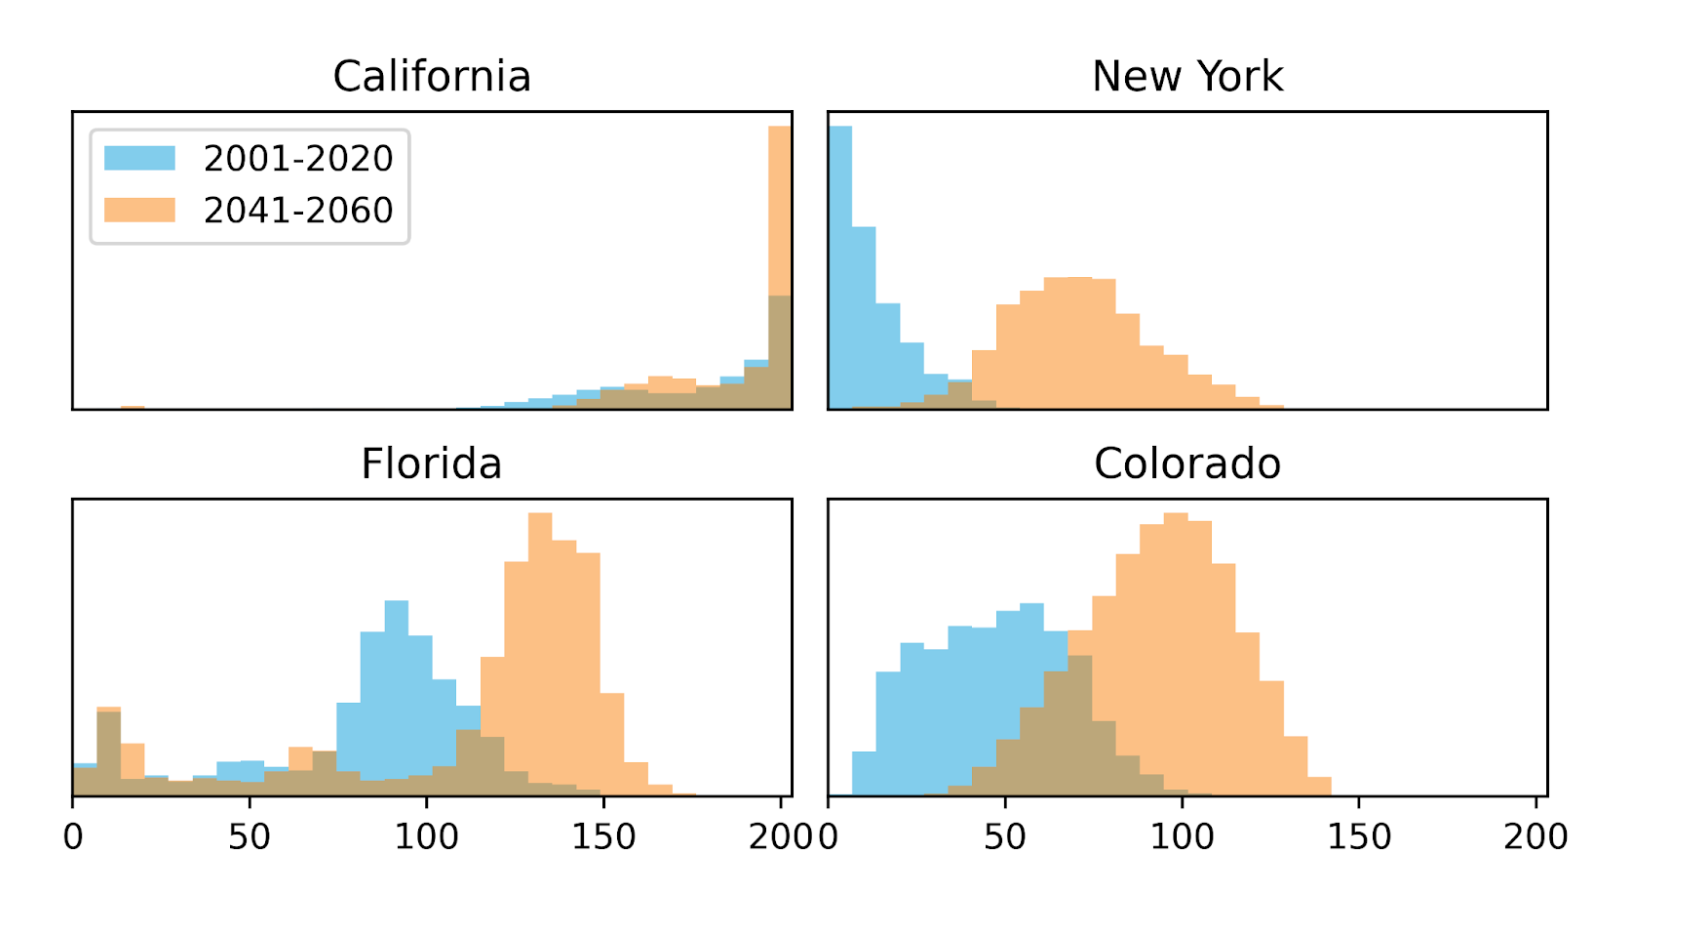
Comparing the distribution of monthly maximum fire weather values (using the KBDI fire weather index) from the recent past to mid-21st century across four states. Many of the future expected KBDI values are outside of the range of historic observations, making modeling the impact of these values challenging.
Comparing the distribution of monthly maximum fire weather values (using the KBDI fire weather index) from the recent past to mid-21st century across four states. Many of the future expected KBDI values are outside of the range of historic observations, making modeling the impact of these values challenging.
Modeling the future
The expected fire future - with unprecedented heat and drought in areas with large amounts of biomass - surely means that fire will get worse in many places. But good climate intelligence requires quantitative and spatially specific risk estimation. We know fire risk will increase - but how much higher are future fire probabilities than current fire probabilities? Similarly, we know that the American West will see more fires - but what will the 2040s look like for a specific address in the California suburbs? These are the questions that Sust Global modeling can answer.
Here, we give an overview of two of our modeling approaches to estimate fire risk in an increasingly weird and uncertain future, where traditional modeling approaches don’t work.
Simulations
The most common way to model the future of the climate is to use simulations. This modeling approach is theoretical rather than empirical. A simulation doesn’t use the past as a guide: it instead uses baseline assumptions to form (usually chaotic) pictures of the future. Global climate models, or GCMs, take a whole suite of assumptions about the world - everything from trajectories of human population growth and economic development to laws of fluid dynamics and atmospheric chemistry - and simulate the world's climate future: hour by hour, grid cell by grid cell.
Many of these GCMs include assumptions about wildfire and vegetation. They simulate how fire depletes vegetation, how expanding cities from population growth reduce the amount of burnable vegetation, and how economic conditions affect the availability of fire ignition sources. These simulations can’t give precise predictions, but running different simulations under varying conditions provide an idea of the range of possible futures.
One challenge with GCMs is that they don’t offer precise scenarios: for example they may estimate how frequently fires will happen over large, 100-kilometer areas. Sust improves these fuzzy simulations by using patented AI to “zoom in” on the simulations and give a sharper, high-res projection of future fire risk - an approach we refer to as fireSRnet. This approach uses a cutting edge synthesis of climate simulations and artificial intelligence to make the best possible predictions of future fire risk.
Using strong scientific priors to inform model structure
Another way that Sust Global deals with the challenges of estimating future fire risk in a weird climatological future is to use models uniquely designed for making predictions outside of the available feature space.
It is very common in AI and machine learning to use models that perform well in the range of values used to train the data. Many of the most advanced neural networks can outperform humans on tasks ranging from medical diagnoses to games like chess and Go. However, these models typically fail when applied to new contexts or new ranges of data. For example, a model used to make medical predictions that was trained on a dataset of young, white men will perform poorly when used to make diagnoses on older black women.
Similarly, a model trained on the historic relationship between weather, vegetation, and fire risk would perform well on making predictions over that same time period, or in the future under an stationary climate. However, such a model will perform poorly on the actual future under climate change, because that future will present novel combinations of weather and vegetation conditions outside of what has arisen historically, and many of these contexts are where future fire risk will be highest.
There are a number of strategies that work in unpredictable scenarios, but these may involve re-thinking the basics of what is learnt in an introductory machine learning course. Firstly, there are model forms, such as oblique decision trees and linear regression, that extrapolate from observed trends to make predictions outside of the feature space, rather than make a prediction at the bounds of the feature space. Such models will perform better than most machine learning models that make a prediction at the bounds of the observed feature space.
As an example of models with different approaches to predictions outside of the feature space, see the graph below. A non-linear phenomenon with noisy outcomes is shown in gray. Points in black are “observations”, values that are known and that are used to fit the model. Here, we train both a random forest and a piecewise linear regression model to see how they do beyond the range of observations, on a new observation at the red point. The random forest does better than the linear regression within the range of black points, i.e., within the feature space.
However, beyond the range of the observed data, the true phenomenon shifts upwards, a trend that the linear regression catches but the random forest model misses. This shows how simpler models like linear regression can perform better than more sophisticated models when making predictions outside of the feature space.
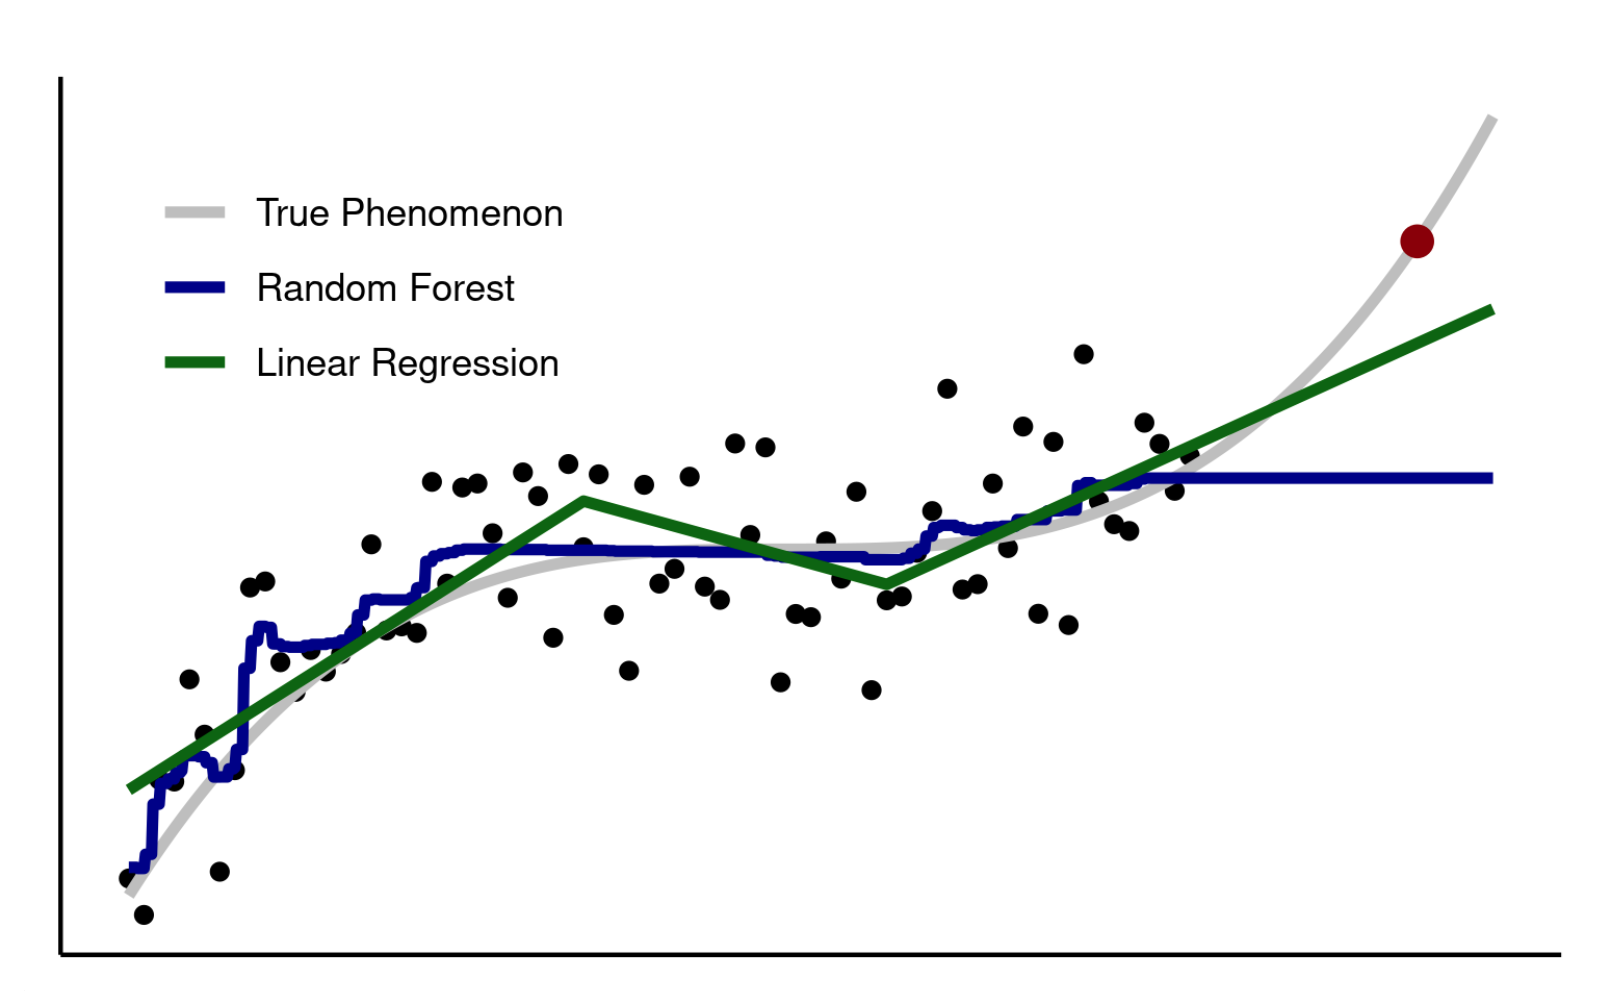
An illustration of models that perform differently on data outside of the feature space. The random forest model performs better than the linear regression over the range of the black points, but then does worse when predicting the new observation at the red point. Note that this is just a representation of modeling approaches and so the x and y axes could represent any two variables - the x could be kbdi and the y could be fire, the x could be time and the y could be stock prices, the x could be temperature and y could be hospitalizations, etc.
Conclusions
Beyond model form, there are other considerations that help us make predictions outside of the available feature space. Firstly, models in this context need to be interpretable. Scientists need to understand why a model is making predictions in order to deduce whether those predictions are plausible. Even if we have never seen a rainforest with a KBDI of 150, can our model’s predictions of fire risk in this context be reasonable? Is it what a scientist would potentially expect to see?
Secondly, it is very important that such models are simple. When making predictions about an uncertain future, overfitting is a huge issue, and even using regularization methods on the training data may still leave the model overfit with respect to out-of-feature space data.
Finally, it is important to test the model on unseen future data. Textbook cross validation approaches involve validating the dataset with portions of the data left out at random. But in the case of a weird future, it is important to test the modeling approach by specifically leaving out the latest observations from the most recent past. For example, train a model on most available historical data leaving out the most recent few years, and test that model on those years.
In the case of wildfires, we are already starting to see signs of “global weirding”: wildfires in the winter, stronger wildfires and wildfires in new areas. If a model fails to predict these emerging signals of climate change with any accuracy, it will surely perform even more poorly on a distant and more unusual future. All of these considerations are key to making successful forecasts about the future climate and its impacts, and are integral to how we think about physical risk exposure modeling at Sust Global.
To learn more about your physical climate risk capabilities and our wildfire projection product, reach out to the team today at contact@sustglobal.com